


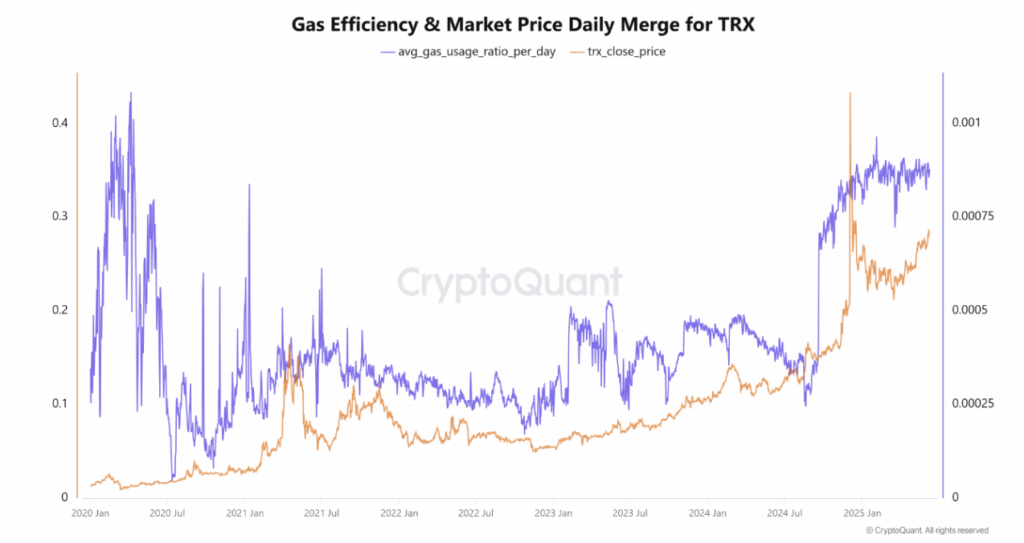
- TRON’s gas usage ratio often lines up with TRX price shifts—but not consistently.
- A notable price rally in late 2024 matched a gas usage spike, hinting at demand-fueled momentum.
- Traders can use gas data as a signal, but it’s no silver bullet—context still matters.
A fresh dive into TRON’s network stats shows a curious (and kinda messy) relationship between on-chain activity and TRX’s market price. Basically, when people start really using the network—spiking gas usage—it sometimes pushes the price of TRX up. Sometimes. Other times, not so much.
The data, pulled from TRON’s own On-Chain Explorer, maps out gas usage ratios against TRX’s closing price in USD from back in 2020 through 2025. And what we get isn’t a straight line. It’s more like a pattern that shows up, disappears, then pops up again later—especially during heavy network action or big market moves.

Network Usage Isn’t Always a Price Trigger
There’ve been phases, like in late 2024 to early 2025, where TRX price soared right as gas usage spiked. That one was pretty clear: folks were piling onto the network, maybe using apps or shifting tokens around, and investors jumped in, too. Utility met hype—and the price took off.
But zoom out a bit, and it’s not always that tidy. In plenty of other cases, gas usage would rise, but the market just… shrugged. Same story the other way—price jumps outta nowhere with no big move on the network. It’s like TRON’s network and its token sometimes speak different languages.
Traders Should Watch, But Not Rely on It Alone
So what does this mean for anyone eyeing TRX trades? Well, the gas usage ratio is a decent early warning system. It shows real-time demand, gives hints about what the network’s up to, and sometimes—if stars align—predicts momentum.
But it’s not a crystal ball. Gas spikes don’t guarantee gains, and flat usage doesn’t mean the price won’t run. The takeaway? Use it alongside price charts, sentiment, and macro signals for a fuller picture.


