


- Tron ($TRX) shows resilience amid market-wide volatility, maintaining strong support around $0.25 while other altcoins falter.
- Technical patterns suggest a bullish breakout, with TRX breaking a descending triangle and targeting the $0.27–$0.35 range—if support around $0.22–$0.23 holds.
- Momentum indicators (MACD, SMAs) are flashing bullish signs, though low volume and broader market conditions mean caution is still warranted.
Tron ($TRX) is holding its ground pretty well—despite the chaos all around. While other altcoins have been tumbling through key supports, $TRX has been chilling near the $0.25 mark, showing signs of stability even with the market feeling a bit shaky.
But don’t let that fool you into thinking it’s full-on bullish just yet. A lot still depends on what Bitcoin decides to do next. If BTC slips, altcoins usually follow.

Resilience Amid Volatility
It’s been a bumpy ride. Markets are seeing wave after wave of sell-offs, but somehow, Tron is sticking close to its range. The token dipped briefly but bounced back quickly—hardly a crash. That kind of price action suggests there’s solid support and that buyers haven’t exactly backed off.
The rise in trading volume backs that up. Folks are clearly still interested.
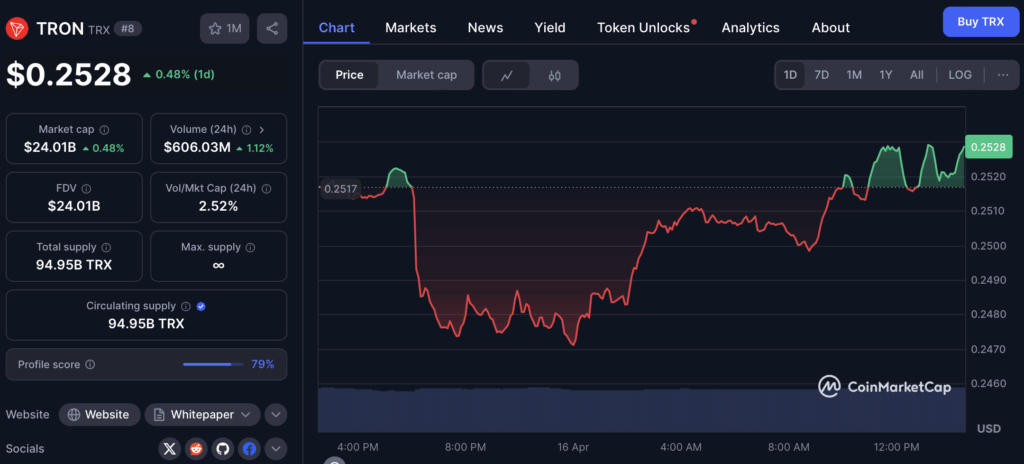
Chart Patterns Point to a Shift
Now here’s where things get interesting. According to technical analysts, Tron’s chart has been forming a descending triangle for a while now—usually a bearish sign—but this one just flipped. The upper trendline has been broken, and $TRX shot up, briefly hitting $0.26.
This break past resistance is a big deal. If buyers can push through the next wall at $0.27–$0.28, we might be looking at a move to the $0.30–$0.35 range. But it’s gotta hold above $0.22–$0.23 to confirm the breakout. If it doesn’t… we could be back in the weeds.
Also worth noting: there’s a bullish order block (OB) and a fair value gap (FVG) in that support zone. Translation? Big players might step in around there—it’s considered a prime buy zone.
Current Price Action and Momentum
After touching $0.2576 recently, the price pulled back slightly and settled near $0.2505. That kind of retracement isn’t unusual—it’s consolidation, not collapse. Support levels like $0.24 and $0.248 are holding up well, giving bulls a decent cushion.
Right now, the market’s not showing crazy volume, but it’s also not flatlining. The price is comfortably above both the 50-day and 200-day simple moving averages (SMA), which is usually a good sign. The 50-day SMA is acting like a springboard, keeping buyers engaged.
MACD? Still flashing green. The indicator’s above the signal line, and the histogram bars are rising—another tick in the bullish box.
So What Now?
Tron’s looking like it wants to move, but whether it actually will depends on a few things—broader market sentiment, Bitcoin’s behavior, and whether volume can pick up some steam. For now, the bulls have the upper hand, but that can shift real fast.
Still, if support holds and buyers stay active, $TRX might be gearing up for a proper breakout.


