


- SUI is hovering above a key $3.06 support, with Elliott Wave analysts warning of a potential drop to $2.72–$2.09.
- RSI and MACD indicators point to growing bearish momentum with no clear signs of reversal.
- Volume remains low, and repeated failed breakouts suggest sellers are still in control.
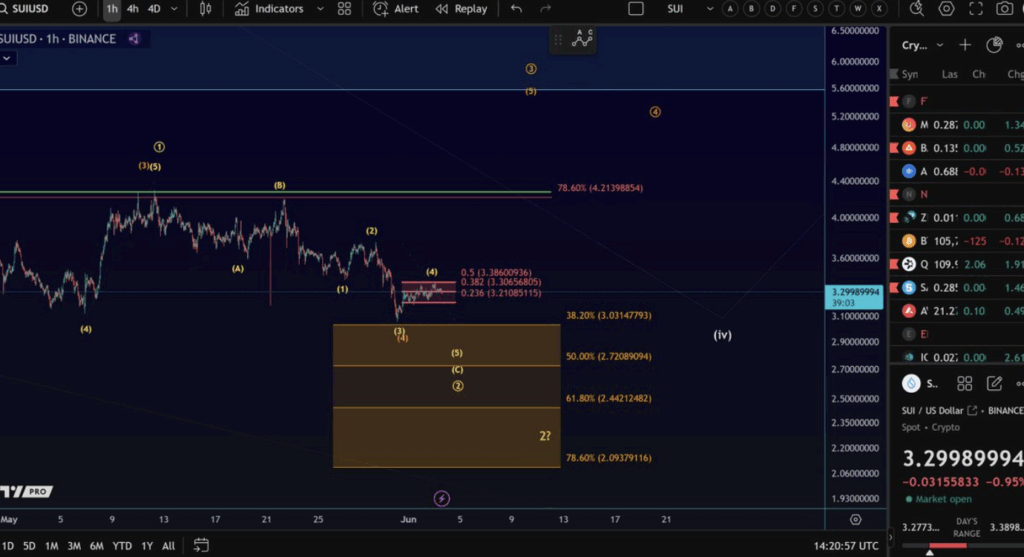
The SUI token, which powers the Sui Blockchain, might be in for a slide if it can’t hang on to that $3.06 support level. According to Elliott Wave analysis from @MoreCryptoOnline, the price has been stuck below $3.38, which seems to be a stiff resistance for now. If support gives way, we could be looking at the start of wave (5) in what appears to be a larger corrective wave (c).
After hitting its peak back in May, SUI’s been sliding in what analysts think is a corrective pattern. The chart also shows a bunch of Fibonacci levels clustering around the $3.06 area. If that cracks, the next safety net lies somewhere between $2.72 and $2.09 — not exactly a small drop.

Bearish Signals from RSI and MACD
The indicators aren’t offering much comfort either. On the daily chart, the RSI sits around 42. That’s a bit low and suggests that momentum is drifting toward the bears. If it keeps dropping, that’ll probably confirm a continuation of the downtrend before we see any real bounce.
Over on the MACD, it’s more of the same. There’s a bearish crossover in play, with the MACD line under the signal line and red bars stacking on the histogram. It’s a pretty textbook look for a downtrend continuation.
No Real Volume Shift or Recovery Signs Yet
Another red flag? The price chart is making lower highs and lower lows — a pretty clear pattern of a downtrend setting in. SUI’s failed attempt to crack $3.38 in May only added to that selling pressure, and there hasn’t been much follow-through on volume either. Without a spike in buying interest or a big reversal candle, there’s not much to say a turnaround’s coming just yet.
For now, holders and traders alike are probably watching $3.06 like a hawk. If that level breaks, things could get messy.


