


- Solana’s RSI has climbed from 39 to 54.5, but failure to cross 60 suggests bulls are still hesitant.
- The Ichimoku Cloud remains thick and red, indicating strong resistance and an ongoing bearish trend.
- Despite short-term strength, SOL needs a major push above $170 to signal a true reversal.
Solana’s been in a rough patch lately. Even though it bounced a bit recently, it’s still trading under $170 — and that’s been the case since the end of May. The market cap’s holding above $80 billion, which sounds good on paper, but zoom in and it’s dropped over 10% in the last 30 days. Buyers are poking around again, sure, but the momentum feels… fragile at best.
The RSI — which kinda shows how strong or weak the trend is — climbed from 39.26 to 54.51 in the past three days. That’s a decent jump. But it’s still not able to punch through 60, and without that, it’s hard to say the bulls are fully back. The overall structure? Still leaning bearish. The EMA setup’s not doing SOL any favors either — short-term lines are hanging under the long ones, which usually means sellers are still in control.

Momentum Builds, But Bulls Still Playing It Safe
The RSI’s move from under 40 to above 54 is definitely a sign of interest returning. Buyers are sniffing around, but they haven’t committed just yet. Pushing past 60 would be a clearer signal that momentum’s actually shifting. For now, we’re stuck in this awkward middle zone — kinda bullish, but not quite confident.
In simple terms, RSI between 50 and 60 is that place where bulls and bears are still staring each other down. Above 70? That’s too much excitement. Below 30? Panic. So being around 54 means… cautious optimism. But if buyers don’t show up soon, this recovery might just fizzle.
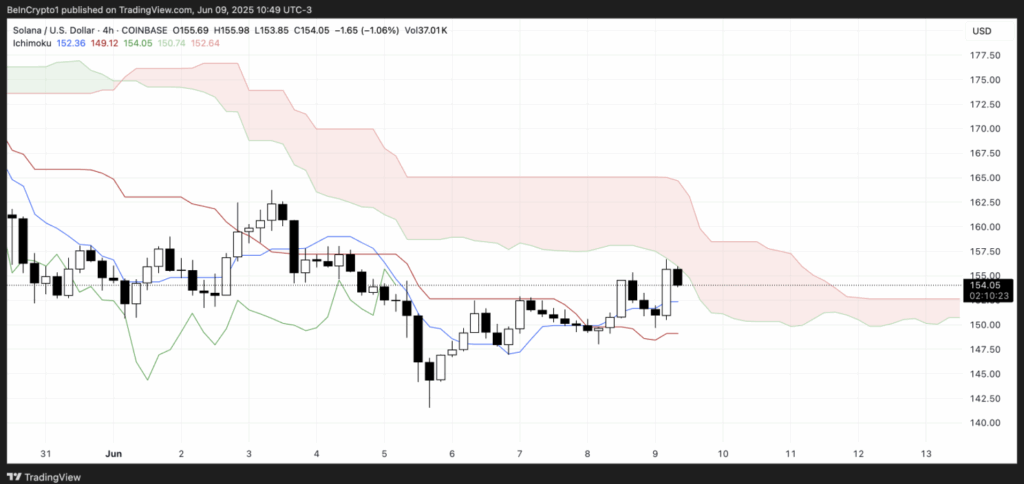
Thick Clouds, Heavy Resistance: SOL’s Still in the Fog
Solana’s price is now trying to fight its way through the Ichimoku Cloud — a tool traders use to spot trends and pressure zones. Unfortunately, it’s the red cloud we’re talking about here, and it’s not a thin one either. Thick clouds mean tough resistance, and in this case, it’s signaling that the bearish setup hasn’t cracked yet.
Even though the Tenkan-sen (the fast-moving line) crossed above the Kijun-sen (the slow one), which can be a bullish sign, it doesn’t mean much while the price is still stuck inside the cloud. What’s worse? The leading indicators — Span A and Span B — are still showing the bearish layout. Until those flip, any breakout hopes stay murky.


