


- 2.8M SOL flowed into Binance last week, triggering a 7% price drop; funding rate turned positive on June 8.
- While short-term momentum looks slightly bullish, volume and OBV trends still point to caution.
- A break above $162 could flip the 4H structure bullish and offer swing trade potential.
Last week, Solana [SOL] got hit with a wave of tokens heading straight for Binance—2.8 million SOL, to be exact. That kind of inflow typically sets off alarms, and this time was no different. The price slid from $155 down to $143, marking a 7% dip that lined up with that bearish pressure. Funny enough though, the funding rate actually flipped positive on June 8, hinting at a slight shift in trader sentiment.
But let’s be real—despite that flicker of optimism, SOL’s been in a pretty clear downtrend for about three weeks now. Any short-term gains? They’re more like speed bumps than signs of a breakout. Still, if you’re a nimble trader, there may be opportunities to ride this shift in momentum for some quick upside.

Daily Chart Shows Signs of Life—But It’s Not a Trend Reversal Yet
Looking at the 1-day chart, Solana’s structure has been bearish since mid-May. It came back down to retest the $143 support level, which was a key zone flipped earlier in April. After touching that line again, SOL bounced back nearly 8.5% over the following three days—a solid reaction from buyers. Doesn’t scream reversal, but it does show demand still exists.
Problem is, the Money Flow Index (MFI) suggests sellers still have the upper hand. Volume’s also been sluggish—the 20-day average has been drifting lower as SOL pulled back. The On-Balance Volume (OBV) has been sliding south too, and unless that flips, talk of $178 or higher is just wishful thinking for now.
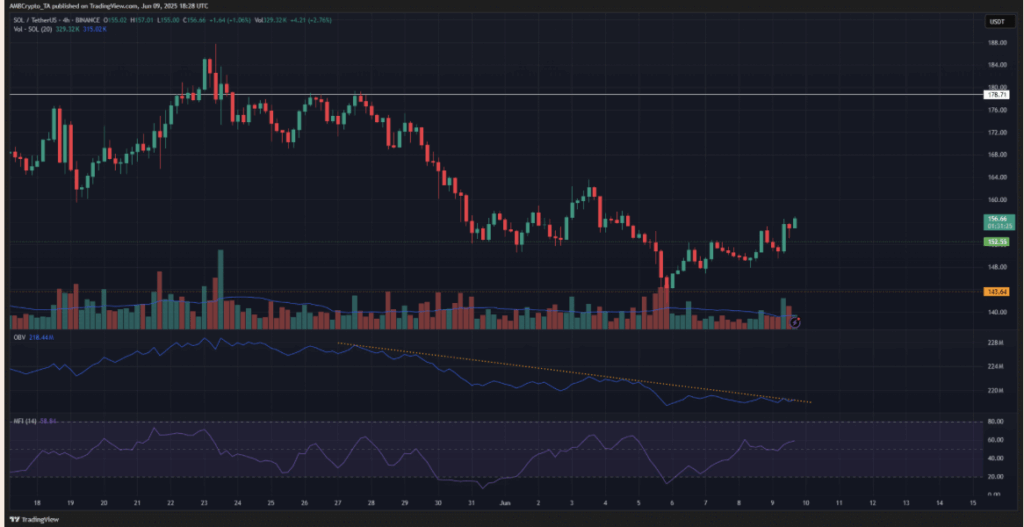
4H Chart Offers Clues for the Short-Term Players
Zooming into the 4-hour chart, the OBV is still under pressure, stuck under a descending trendline. It hasn’t been broken yet, but it’s getting close. If buyers can push it past the local high from early June, that’d be the first real sign of strength from bulls. Until then? Caution is key.
On a brighter note, the MFI on this timeframe is climbing again, moving in sync with price. This implies some fresh buying pressure over the past few days. Still, the market structure on the 4H remains bearish. That $162 mark—that’s the lower high from earlier this month—is the line to watch. If SOL can clear it, swing traders may finally have something to get excited about.


