


- Over $120M in liquidity has returned to Solana, mostly from Ethereum and Arbitrum, fueled by renewed interest and surging memecoin prices like POPCAT and BONK.
- Despite the hype, Solana’s fee generation has dropped sharply, with April fees sitting around $22M — far below January’s $400M peak.
- SOL remains technically bearish, needing a daily close above $147 to flip bullish, while key support zones sit at $130 and $115 amid ongoing bearish divergences.
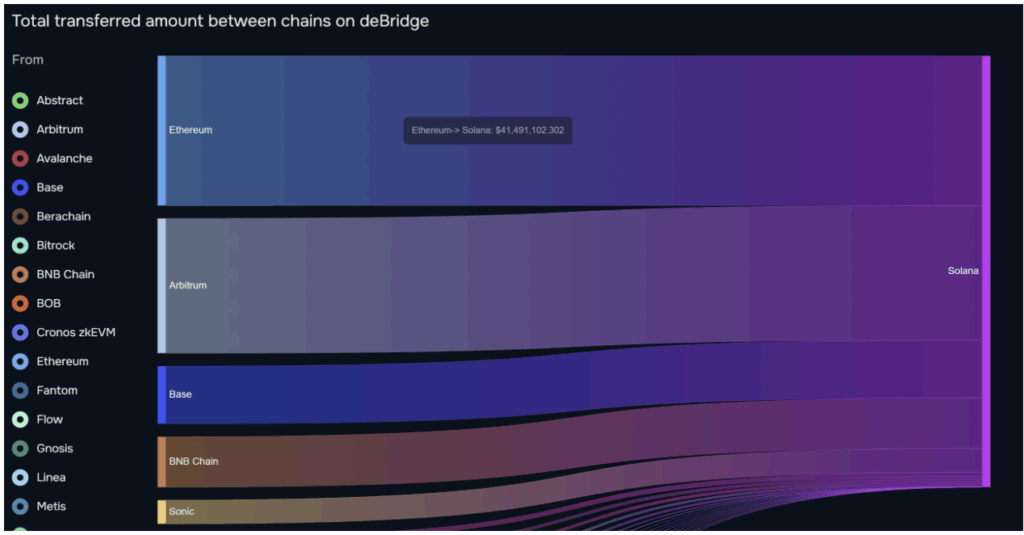
Over the last month, more than $120 million in liquidity has been bridged to Solana — a notable sign of renewed interest in the network. Most of that cash came from Ethereum — around $41.5M — followed by $37.3M from Arbitrum, according to data from Debridge. Even Base, BNB Chain, and Sonic chipped in with $16M, $14M, and $6.6M respectively. Money’s moving, no doubt.
From Exodus to Comeback?
Not long ago, it was a very different story. After the whole LIBRA memecoin fiasco in Argentina, which somehow roped in President Javier Milei (yeah, that happened), investors pulled $485 million out of Solana and moved it to chains like Ethereum and BNB.

Now? Things are flipping. Solana’s seeing memecoins fly again — names like POPCAT, FARTCOIN, BONK, and WIF have jumped 79%, 51%, 25%, and 21% just this past week. That kind of momentum tends to attract attention — and liquidity.
Fees Are Lagging Behind the Hype
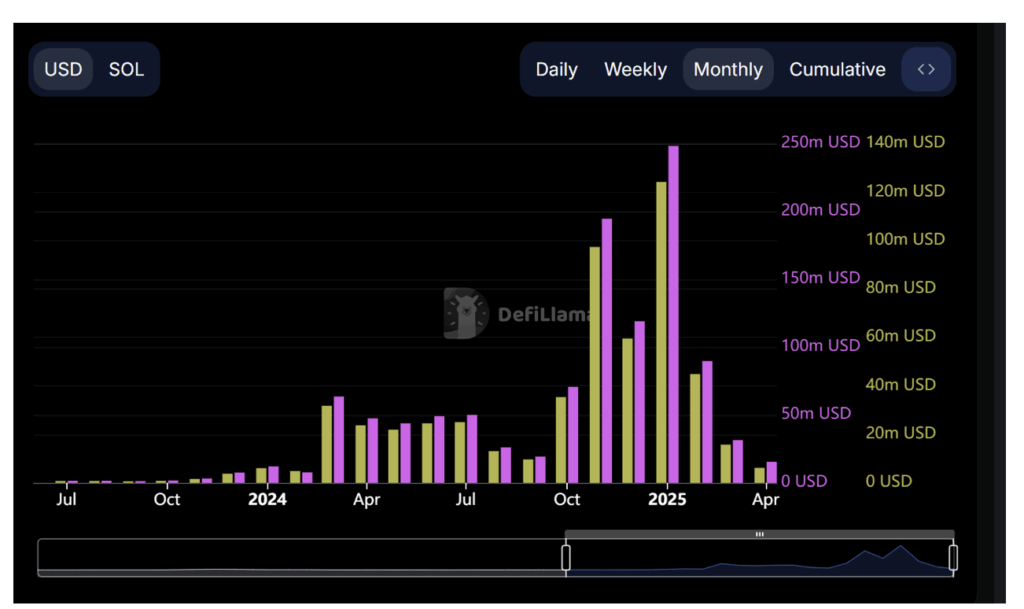
Despite the influx and meme coin mania, Solana’s actual fee generation isn’t keeping up. March saw just under $46 million in total fees. For comparison, January 2025? That number was over $400 million. April’s not looking much better so far — sitting around $22 million and counting.
So yeah, while the vibes are back, the actual revenue numbers… not quite.
Technically Speaking: SOL Still Has Work to Do
Price-wise, Solana is still trying to break through some tough levels. Right now, it’s trading under $140, and the 50-day EMA is acting like a wall. To really shift the trend, SOL needs to close above $147 on the daily chart. Without that, the bearish structure stays intact.
Zoom into the lower time frame (LTF), and it’s not super pretty either. A bearish divergence has popped up again between price and RSI. If history repeats — and it has a few times this year — this could signal another dip incoming. Since January, we’ve seen four bearish divergences, all followed by corrections.
The setup looks eerily similar again: price briefly popped above the 50-day and 100-day EMAs on the 4-hour chart, but couldn’t hold. That move usually doesn’t end well.
Support and Resistance: The Key Levels to Watch
Looking ahead, Solana’s immediate demand zone sits between $115–$108 — that’s where buyers could step in again. But interestingly, there’s a bit of strength building around $130, too.
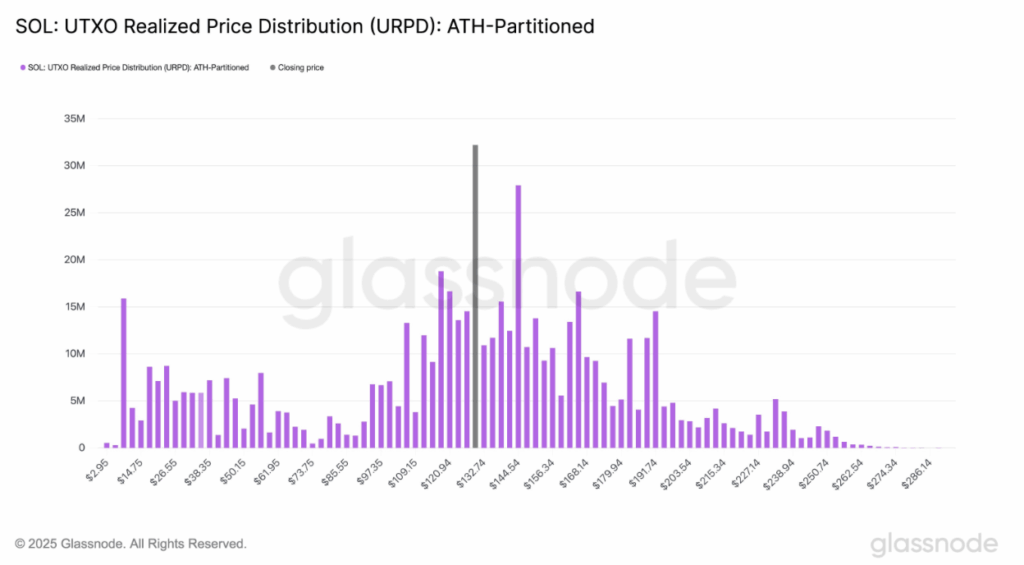
In a recent post on X, Glassnode noted that over 32 million SOL (that’s around 5% of total supply) was bought at the $130 level. That kind of concentration usually creates a strong support zone.
They added:
- $129 is the pivot.
- $117 could form the lower support.
- $144.50 might be the top of the current range.
So, in short: Solana’s in a squeeze — momentum’s building, but unless it can punch through $144–$147, there’s still risk to the downside. At least for now.


