


- Solana is testing key resistance around $188, with analysts predicting a breakout could drive the price to $200 or even $250–$260 if momentum holds.
- Bullish chart patterns like the cup-and-handle and ascending wedge suggest strong technical support, backed by rising volume and higher lows since early 2024.
- As long as SOL stays above $160, the broader uptrend remains intact, with traders showing increased confidence as funding rates turn positive and buy walls form near $164.
Solana (SOL) has been making some noise lately—quietly stacking up technical wins and getting the attention of analysts and traders alike. The price has been climbing toward a sticky resistance zone near $188, and a lot of eyes are watching to see if it can break through. If it does? Well, some folks are already whispering about a run to $250—or even higher.
$200 in Sight: A Breakout or Just More Noise?
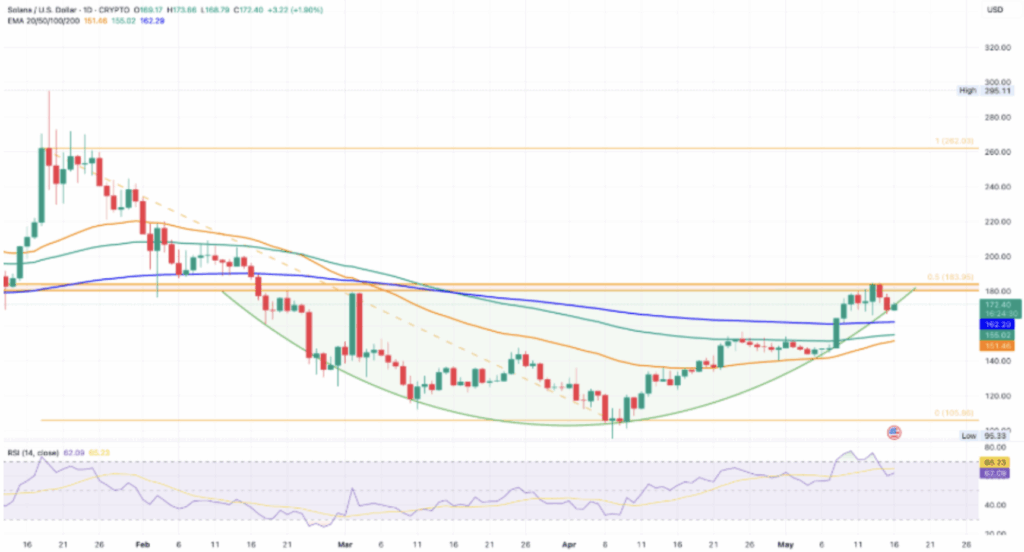
Right now, Solana’s hanging out near the $180–$188 zone. It’s a tough area, one that’s acted as a roadblock more than once before. But this time, the vibe’s different. Analysts are noticing a pattern, and the four-hour and daily candles? Yeah—they’re looking pretty green.

A popular voice on X, CryptoCurb, pointed out three clean breakouts from similar zones in the past. Each one led to a new leg up. He’s saying this new push above $180, especially with rising volume, might be the beginning of something bigger. If SOL can stick the landing above $188? The next marker is $200.
$250, Maybe $260? Bulls Are Getting Bolder
Zooming out a bit, another analyst, Kurnia Bijaksana, sees the potential for even more upside—like, way more. He thinks $250–$260 could be in play if SOL keeps riding this momentum. His chart shows a rounded base forming this year—classic bullish structure—and with higher lows stacking up, things are lining up.
Then there’s CoinSignals, another voice chiming in. They’re eyeing a return to $260 too, pointing out that Solana’s done it before—twice actually—after clearing the $180 mark. Looking at the weekly chart, he spots an ascending wedge, aiming not just for $260 but all the way to $320 if the rally holds.
Oh, and don’t forget Ali Martinez. He threw in a cup-and-handle pattern on the weekly. If SOL breaks the neckline at $216, he says, things could get explosive. Like parabolic, seriously.
Breakouts Everywhere, But What’s the Catch?
Lately, Solana’s been putting in some textbook breakout behavior—lower highs bouncing off trendlines, then snapping back up. We saw a move from $170 to $185 just like that. It’s becoming a pattern.
But—yeah, there’s always a but—analysts are still watching key support zones closely. If SOL slips below $172, it might dip a bit before regrouping. Still, anything above $160 keeps the broader uptrend intact.
Right now, resistance is being tested between $174 and $188. There’s been rejection here before, but if bulls shove past $188 with some volume behind them, it might kick off a sprint to $220–$240. Derivatives data’s showing positive funding too—so traders are clearly leaning bullish, positioning for what they hope is the next leg up.


