


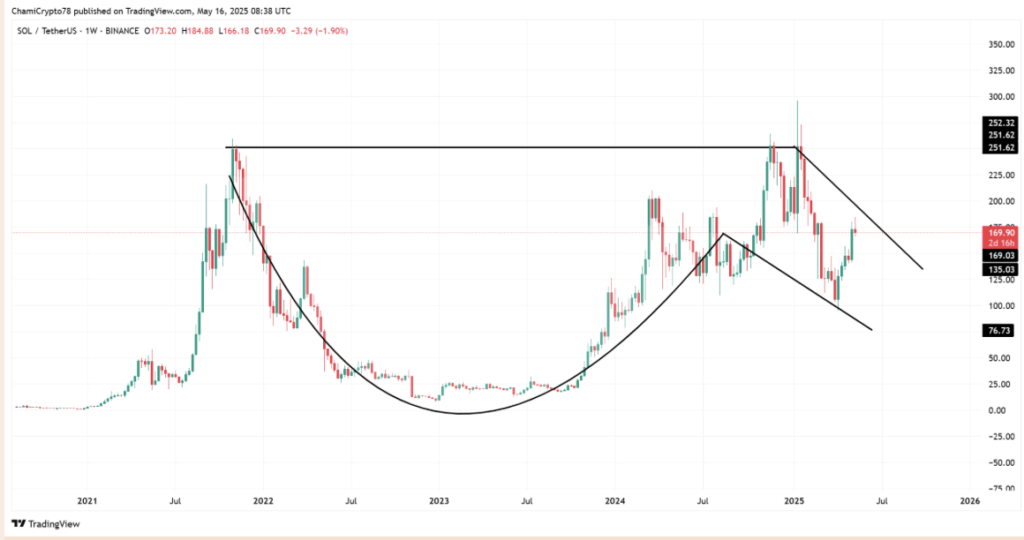
- Solana Eyes Key Breakout: SOL is forming a classic cup-and-handle pattern on the weekly chart, with resistance between $200 and $210. A breakout above this zone could trigger a strong bullish move, but the price is currently sitting at $170.20 after a slight pullback.
- Mixed Sentiment and Long Bias: While Binance data shows a heavy long bias with 70.53% of traders positioned for upside, sentiment remains slightly negative at -0.46, suggesting caution despite the bullish technical setup.
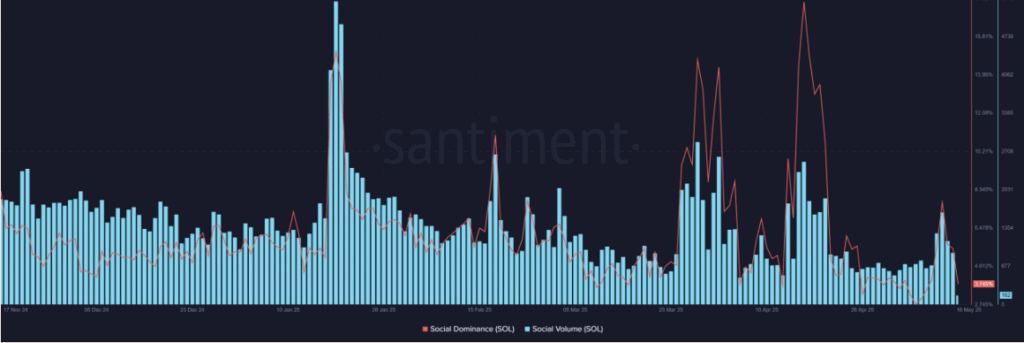
- Retail Interest Fades Amid Uncertainty: Social metrics show declining engagement, with volume down to 162 and dominance slipping to 3.74%. A push above $200 could reignite interest, but without stronger accumulation or sentiment reversal, the market remains hesitant.
Solana’s chart is cooking up something interesting – a classic cup-and-handle pattern on the weekly timeframe. After bouncing off $135, SOL’s now pushing toward the neckline resistance between $200 and $210. But with the price currently sitting at $170.20, down 1.57% in the last 24 hours, the big question is whether bulls can muster enough momentum to break through.
Eyeing the $200 Mark – Will SOL Break Out?
Despite the slight dip, the handle structure is still holding up, and the descending trendline remains under pressure. A breakout above $200 could kick off a stronger bullish leg, potentially validating the reversal setup. But for now, it’s all about testing that resistance zone.

Exchange Flows – Holding, Not Exiting
On May 16th, exchange flow data showed $148.49 million in inflows against $149.55 million in outflows – almost a deadlock. The narrow gap suggests selling pressure isn’t overwhelming, but there’s also not a ton of conviction behind the buying either.
This balanced flow usually supports bullish setups, especially near major resistance levels. But with no major outflow spike, it’s clear that stronger accumulation signals might be needed to push SOL above $200 convincingly.
Long Bias Dominates – But At a Risk
Binance data reveals that 70.53% of traders are holding long positions, with a Long/Short Ratio of 2.39. That’s a heavy tilt toward the bulls, signaling strong upside expectations. However, it also creates a risk of liquidation if the price reverses – too many longs could lead to a cascade of stop-loss hits.
Still, as long as the price action holds steady, the high long interest could fuel a rapid breakout if $200 gets taken out. If shorts start to cover, the move could get amplified quickly.
Sentiment Remains Cautious – But Is That a Good Thing?
Interestingly, Solana’s weighted sentiment is still negative at -0.46, indicating that despite the bullish chart setup, market participants remain cautious. Historically, rallies that start under bearish sentiment tend to run longer – less hype means fewer late buyers to trap.
But if SOL can’t clear $200 soon, that pessimism could deepen, adding more weight to the downside risk.
Retail Interest Fades – Is That a Red Flag?
Social metrics are also cooling off. Volume dropped to 162, while dominance slipped to 3.74%. Solana’s not the hot topic in retail circles right now, but that could work in its favor. Less noise often sets the stage for bigger moves – though a spike in social volume would help confirm that the crowd is starting to pay attention again.
Bottom Line – Promising Setup, But Confirmation Needed
Solana’s chart structure is as textbook as it gets – a clear cup-and-handle with strong long-side positioning. But the broader market isn’t entirely on board yet, with sentiment still leaning bearish and social interest fading.
If SOL can break above $200 and hold, it could spark a run toward previous highs. But without stronger accumulation or a sentiment shift, the market may stay in wait-and-see mode for now.


