
- PEPE slipped 8.8% last week after a strong monthly rally, entering a correction phase—but technical indicators like the Money Flow Index (MFI) still show strong liquidity inflows, suggesting a possible bounce.
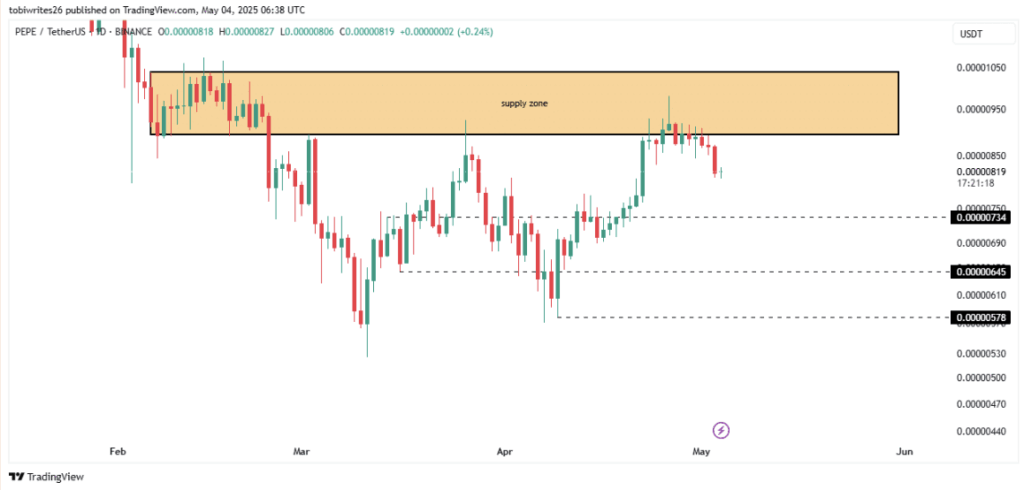
- The memecoin is testing the mid-range of its Bollinger Band, which previously led to an upside breakout; however, it faces strong overhead resistance and key support levels around $0.00000734, $0.00000645, and $0.00000578.
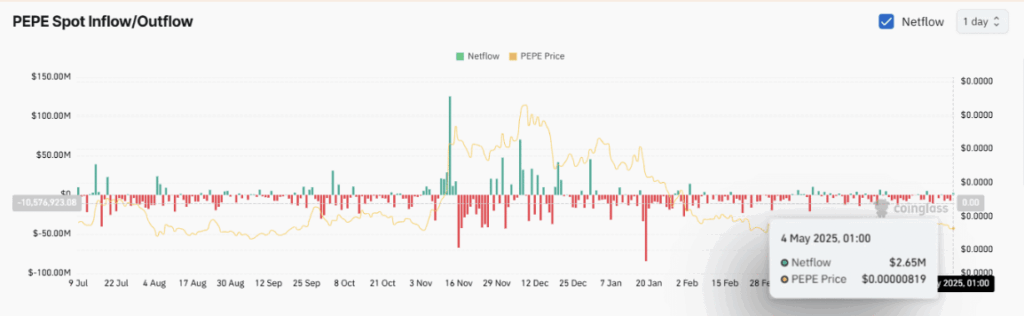
- Market sentiment is mixed, with futures traders turning bullish (funding rate at 0.0121%) while spot traders recently sold off $2.65 million in PEPE, signaling uncertainty in the short term.
Pepe [PEPE] might be cooling off a bit after a fiery run last month. The memecoin surged over 20% in April—but yeah, the past week? Not as pretty. It slid down about 8.8%, mainly due to some renewed selling pressure hitting the market.
Still, not all hope is lost. Zooming out, this pullback might just be a classic correction—a quick pause before the next leg up.
Mid-Band Bounce or Rejection?
PEPE is now hanging out right in the middle of the Bollinger Band range on the daily chart. This mid-band spot tends to act like a bit of a coin toss—it can either bounce the price up or slap it down.
Now here’s where it gets interesting: last time PEPE landed in this exact zone (yep, the same mid-band range), it sprang up and kicked off another rally. Could history repeat itself?
Might be. Especially considering that liquidity is still flowing in strong.
Liquidity’s Looking Juicy
Let’s talk Money Flow Index (MFI) for a sec. It’s basically a tool that tracks how much cash is moving in and out of a coin. Right now? PEPE’s MFI is sitting pretty high at 72.01. That means inflows are outpacing outflows—which usually signals bullish vibes.
So even with the recent dip, money’s still coming in. That’s something.
Bumps Ahead: Major Resistance Could Test Bulls
If PEPE does try to climb again, it’s got a bit of a hill to climb. There’s a supply zone up ahead that’s likely to act as resistance. If buyers don’t show up in force, it could trigger another leg down.
If that happens, keep your eyes on the key support levels at $0.00000734, $0.00000645, and $0.00000578. Those are the areas where a bounce might kick in.
Market Split: Futures Say Yes, Spot Says “Eh…”
So here’s where things get messy. Futures traders? Pretty optimistic. The Open Interest Weighted Funding Rate jumped up to 0.0121%—which is solidly bullish. That shows most open futures are betting on a rise.
But spot traders? Not as excited. They just dumped $2.65 million worth of PEPE in a single day. Kinda wild, considering they were buying just days before.
This divergence between futures and spot trading means sentiment is still kinda all over the place. Until things lean clearly in one direction, don’t expect smooth sailing.