


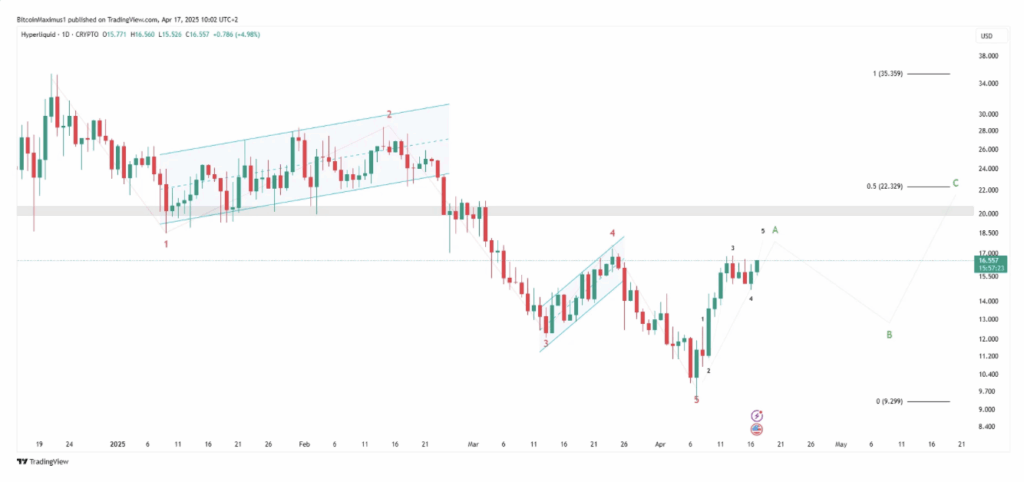
- HYPE rallied 80% off its April low of $9.29, rebounding after a 75% drop from its December 2024 all-time high of $35.73.
- The price is approaching key resistance around $20, with bullish technicals (like RSI and MACD) and a descending wedge pattern signaling potential for a breakout.
- Wave analysis suggests a correction may come next, but another push higher — possibly toward $22 — could follow as part of an A-B-C corrective structure.
Hyperliquid (HYPE) isn’t messing around in 2025. After crashing hard earlier this year — like, really hard — the token pulled off a wild 80% bounce off its lows. Now, with resistance looming just 25% above its current price, traders are watching closely to see if this rally still has legs… or if it’s about to run out of gas.
From ATH to Rock Bottom — And Back (Sort of)
Let’s rewind real quick. Back in December 2024, HYPE was on fire — blasting past $35 and setting an all-time high after climbing over 200%. Fast forward to early April 2025? Yeah… things weren’t looking so hot. HYPE had dumped a brutal 75%, bottoming out at $9.29 on April 7.

But then — boom. Bounce.
Since hitting that low, the price has jumped nearly 80%, and now we’re staring down the next big test: the $20 zone.
A Bullish Pattern’s Building Beneath the Surface
So here’s the technical setup. On the weekly chart, HYPE’s been stuck inside a descending wedge since that December peak. And April 7? That was the wedge’s support line — where HYPE bounced with a strong bullish candle.
Classic chartwatchers love this stuff. The descending wedge is a bullish pattern, and now HYPE is flirting with the upper resistance of the wedge, which also lines up with horizontal resistance around $20.
A breakout above that? Could flip the whole narrative bullish.
RSI, MACD — and the Signs They’re Flashing
Both the RSI and MACD are backing the move. Before the rally, they flashed bullish divergences — momentum was rising even as price was dropping, which usually hints at a reversal.
Now? RSI is sitting comfortably above 50, and the MACD has flipped positive too. All good signs that this isn’t just a random pump, but something with real momentum (at least for now).
Wave Count Says There’s More To Come — After a Breather
Digging into wave theory, it looks like HYPE just wrapped up a five-wave drop from its highs — and we’re now riding wave A of a classic A-B-C corrective structure.
Here’s what that means in plain English: the rally we’re seeing might not be the start of a full-blown bull market just yet — but it’s probably not over either. After this current surge, we could see a pullback (wave B) before one more push higher (wave C).
The target for wave C? Somewhere between $20 and $22.39, depending on how the next correction plays out.
So… What Now?
HYPE’s made a strong comeback from its April low, and the $20 zone is now the make-or-break level. If bulls manage to flip that resistance into support, this thing could fly again. But short-term? A bit of consolidation or correction wouldn’t be a shock — in fact, it’s kind of expected.
Long story short: momentum’s real, the chart looks promising, and even if we see a dip first, another leg up could still be on the table. Traders just need to watch how price behaves near this key resistance — that’s where the next big move will likely be decided.


