


- HBAR is consolidating around $0.17 after a drop from $0.195, with open interest and volume showing reduced trader conviction.
- Despite slight gains and increased volume, key resistance at $0.175–$0.180 remains unbroken, keeping the short-term outlook neutral.
- Weekly indicators like RSI and BBP suggest weak momentum, and a break below $0.16 could open the door to further downside toward $0.12.
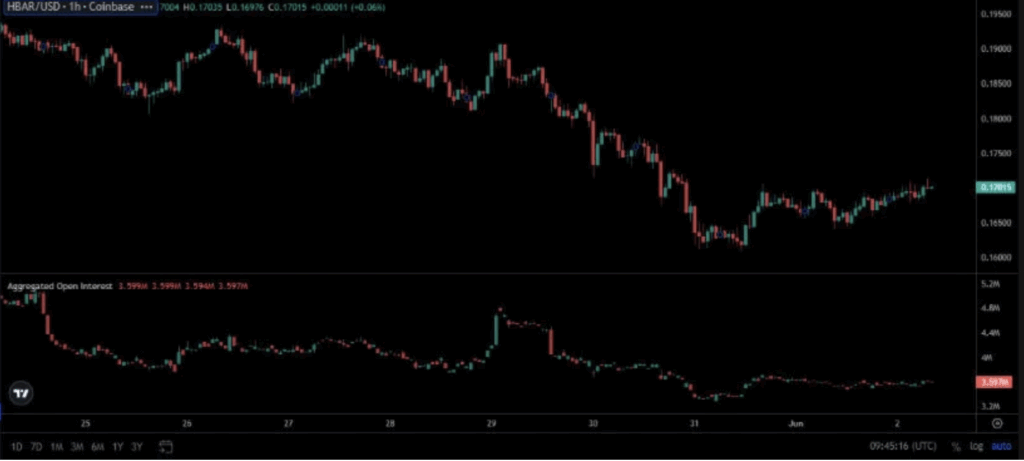
Hedera Hashgraph’s been stuck in a tight little range lately—hovering around $0.17 after falling from recent highs. The dip wasn’t exactly small either, with HBAR sliding from $0.195 to $0.162 between May 27 and May 30. Big red candles on the hourly chart made it clear: sellers were in control. But now? Things have cooled off a bit, and price action’s started to settle somewhere between $0.165 and $0.170.
There’s a bit of indecision in the air. Open interest spiked around May 29—probably a lot of folks trying to catch a bottom—but it fell off again shortly after. That drop, paired with sideways price movement, suggests that neither bulls nor bears are fully committed at the moment. It’s like the market’s holding its breath, waiting to see where things go next.

Volume Hints at Quiet Accumulation—but No Breakout Yet
Zooming out a little, the 24-hour chart from June 2 shows a tiny bounce, with HBAR up 1.08% on the day. Not earth-shattering, but better than red candles. Volume ticked up too—hitting $105.94 million at one point—which makes it feel like there’s at least some real buying going on, not just bots messing around. That said, the gains are still modest, and there’s no real sign of a breakout. Yet.
If HBAR’s gonna make a move, it’ll need more volume behind it—otherwise, it might just keep bouncing around between support and resistance. And right now, that resistance zone is sitting around $0.175 to $0.180. Without a push past that area, backed by real momentum, bulls are just spinning wheels.
Weekly Charts Still Look… Meh
On the weekly chart, the picture doesn’t change much. As of June 2, HBAR was up just 0.77% for the week—barely noticeable when you zoom out. Candles have small bodies, mixed colors, and not a whole lot of direction. The BBP indicator is sitting at -0.03333, which means price is chilling closer to the lower Bollinger Band—not exactly where you wanna see strength.
RSI is another snooze fest. It’s parked at 47.08—just under the neutral line—and hasn’t broken above its own moving average. For bulls to get anything going, RSI would need to jump past 50 and be backed by volume. Until that happens, the risk of drifting back toward $0.16 or even as low as $0.12–$0.13 stays on the table.
Still Waiting for the Break—Up or Down
So yeah, the outlook right now? Pretty neutral. HBAR’s showing signs of less selling and some minor strength, but nothing solid yet. Unless it pushes above that $0.175–$0.180 level with solid open interest and volume, traders are probably in wait-and-see mode.
If price slips under $0.16 with volume creeping up, that could trigger a move lower toward the next support zone. But if bulls step up, and volume spikes with momentum, then maybe—just maybe—we’ll finally get a breakout to talk about. For now, though, it’s just a sideways grind.


