


- HBAR is up 5% in the last 24 hours, but key trend indicators still show weak momentum and indecisive price action.
- Technical signals like the DMI and Ichimoku Cloud hint at a possible bullish shift, but the market remains sideways until a stronger breakout occurs.
- Support at $0.156–$0.153 is holding for now, but if bulls can’t push past $0.168, the price risks dropping toward $0.124 in a deeper pullback.
Hedera’s native token, HBAR, is showing a bit of a pulse—up more than 5% in the past 24 hours. That’s a solid bounce after what’s been a pretty rough start to April. But here’s the thing… the broader trend still looks kinda weak. The bulls are hanging in there, sure, but technical signals are mixed, and momentum? Still shaky.
Momentum Stuck in Neutral
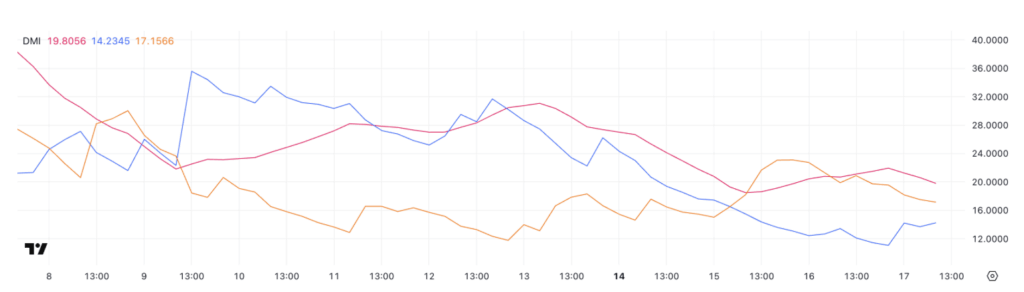
Let’s start with the DMI (Directional Movement Index), which gives us a decent sense of how strong the current trend is. Right now, HBAR’s ADX is sitting at 19.8. That’s a slight bump from 18.49 a couple days ago, but still down from a recent peak of 21.94 earlier today. Anything below 20 usually just screams “meh.”

That means, technically, HBAR’s trend strength is kinda… well, soft. Not bullish, not bearish. Just drifting sideways.
Meanwhile, the +DI (that’s the bullish pressure) crept up from 13.42 to 14.2. Not exactly fireworks, but it’s something. The -DI (bearish pressure) dropped from 19.89 to 17.15, so there’s a bit less weight from the bears now. That narrowing gap could be early signs of a trend flip—but it’s too early to call.
If +DI crosses above -DI with some real volume? That’d be something. Until then, it’s just cautious chop.
Ichimoku Cloud: Mixed Signals Galore
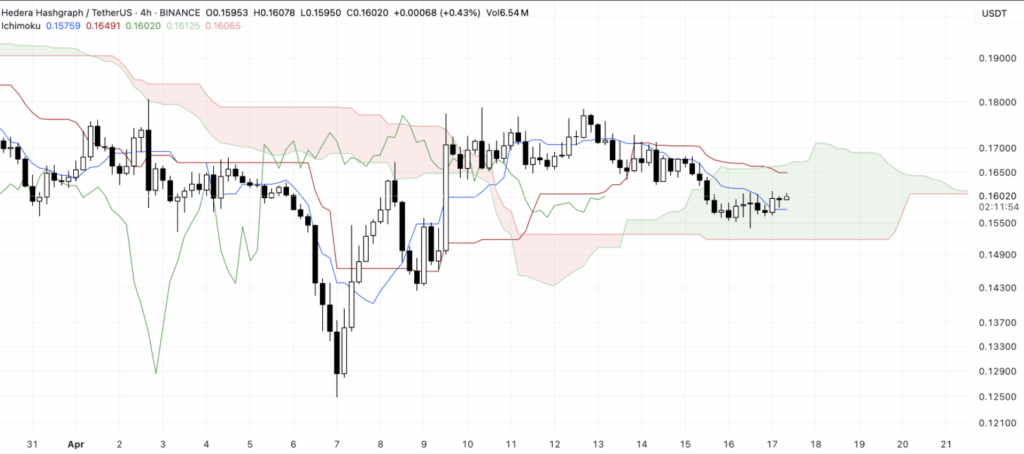
Over on the Ichimoku Cloud chart—yeah, the picture’s still foggy.
HBAR’s price is kinda stuck near the Tenkan-sen and Kijun-sen lines (those are your short- and medium-term trend indicators). And they’re both flat. Which, in trading terms, usually means… nothing’s happening.
The cloud ahead is pretty thick and bearish. The Senkou Span A is under Span B—not great. But price has snuck intothe cloud, which could mean the downtrend is cooling off.
Also, the Chikou Span (that trailing green line) is tangled with past prices. That’s another classic sign of sideways action and uncertainty. TL;DR—no strong push either way yet.
Bulls Defend Support, But Can They Turn It Around?
So here’s the bright spot—HBAR’s managing to hold some key support levels. The $0.156 and $0.153 zones have been tested and, so far, buyers are stepping up to defend them. That’s promising.
If momentum keeps building, the first real test will be breaking through resistance at $0.168. Crack that, and you’re looking at $0.178 next. And if bulls get real serious, $0.201 could be back on the radar.
But… if this bounce fizzles and sellers come back? Then yeah, HBAR could slide right back down to those support levels—and if those fail? We’re staring down the $0.124 range, which would definitely sting.
Final Thoughts
HBAR’s 5% bounce is cool and all, but it hasn’t proven much yet. Until we see stronger volume, cleaner breakouts, and maybe an ADX above 25, the trend’s still kinda lost. The bulls are trying, no doubt—but the market’s still waiting for a clear move.
Stay sharp. This one could go either way.


