


- Recent Drop, But Hope Remains: Dogecoin fell from $0.25 to just above $0.20, signaling short-term weakness, but some analysts see sideways movement as a setup for a potential rebound.
- Long-Term Target of $2: Analyst Setupsfx believes DOGE could hit $2 if it breaks through resistance zones and repeats past accumulation patterns. The path is slow, but the structure supports long-term upside.
- Short-Term Rebound Possible: Analyst Klejdi Cuni spotted an inverse head and shoulders pattern on the 1-hour chart, hinting at a bounce toward $0.25 if DOGE clears the neckline with volume.
Dogecoin’s been on a rough ride lately. Just a few days back—around May 23—it was sitting comfy near $0.25. Now? It’s barely hanging above $0.20. Not the best look short-term, yeah, but some folks think a comeback might be brewing underneath all that red.
One of those optimists is analyst Setupsfx over on TradingView. He pointed out that despite the dip, DOGE is kinda just moving sideways right now. That kind of price action usually shows the market’s not really sure where to go next. Could be the calm before the storm, who knows. He mentioned that DOGE is bouncing between what’s called distribution and accumulation phases—basically, big sell-offs followed by quiet buying. That kind of sideways chop makes predictions tough, no doubt.

Long-Term Vision? A $2 DOGE (Eventually)
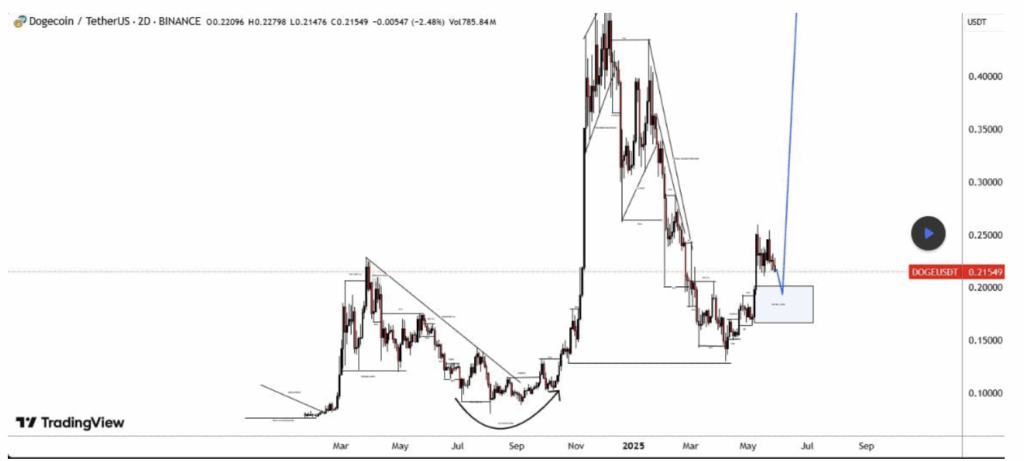
Setupsfx dug deeper into the chart history too. Apparently, there’s been this stubborn descending trendline hanging around since March 2023. It’s blocked DOGE from really popping off more than once—like that $0.14 resistance back in July. That’s been a brick wall.
But here’s the kicker: he thinks DOGE’s gearing up again. The price hit a peak near $0.46 last December, partly thanks to some wild Trump-related buzz in the markets. Since then, it’s dropped back down closer to its old “accumulation zone” near $0.12. Right now it’s trading a bit above $0.16, which has people watching closely. Could be another launchpad. And yeah, he threw out the idea of DOGE hitting $2 someday—like, that’s a 900% jump, so don’t hold your breath, but still, it’s on the map.
Short-Term? Watch That $0.25 Level
On the shorter timeframe, analyst Klejdi Cuni spotted something interesting. He pointed to a potential inverse head and shoulders pattern forming on the 1-hour chart. If you’re into quick trades, this might be your signal. The key moment? If DOGE breaks above the neckline with some volume behind it, a short rally could be in the cards.
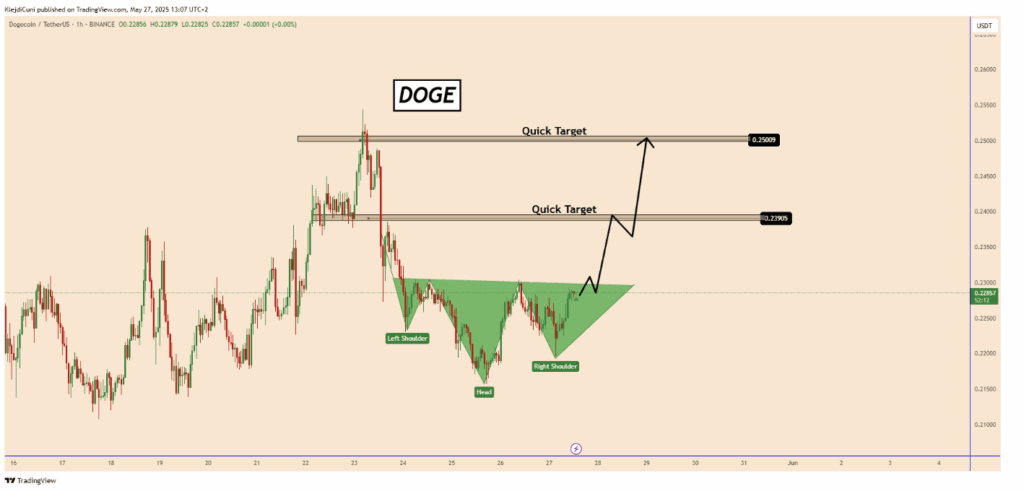
First checkpoint? Around $0.239. Push through that and you’re looking at a shot at $0.25 again—which was the local high earlier this month. It’s also kind of a mental barrier for traders. If that breaks, things might get spicy, maybe even touching $0.30 if the mood’s right.


