


- DOGE’s Breakout & Cycle Setup: Dogecoin recently broke above $0.22, a key resistance level, and is now showing signs of repeating its 2017 and 2021 bullish patterns after rebounding off the 1-month MA50 support.
- $3 Price Target Based on Historical Moves: If the past cycle gains (~2,400%–2,800%) play out again from the recent $0.13 low, Dogecoin could potentially reach $3 before the end of 2025.
- Technical Momentum Building: Despite a short-term pullback to $0.227, indicators like RSI, MACD, and ADX suggest strong bullish momentum is building, with a retest of support at $0.22 possibly setting the stage for a larger move.
Yeah, DOGE took a hit in the last 24 hours, slipping around 6.9%, but zoom out a bit—and it’s been a solid week. After dipping to $0.164 back in mid-May, the meme coin shot up to $0.259 on May 23, breaking past that stubborn $0.22 level that had been capping it since late April. And now, with the broader market flipping bullish, folks are starting to wonder… is this the beginning of something much bigger?
Rebounding Off History: The MA50 Bounce Is Back
Technical charts are throwing out some familiar signals. According to an analysis on TradingView by InvestingScope, Dogecoin just bounced—again—off its 1-month MA50 (that’s the 50-period monthly moving average). If you’re not into chart jargon, just know this same setup happened before Doge exploded in 2017 and again in early 2021. Both times, that bounce was the last little push before things went parabolic.

To spell it out: in 2017, DOGE launched from under a penny to over 1.8 cents. In 2021, it ran from a few fractions of a cent to an eye-watering $0.73. Now? That MA50 support is sitting around $0.13, and price action is starting to rhyme with those earlier surges. If that same pattern plays out again, we could be staring down a $3 DOGE before 2025 wraps up.
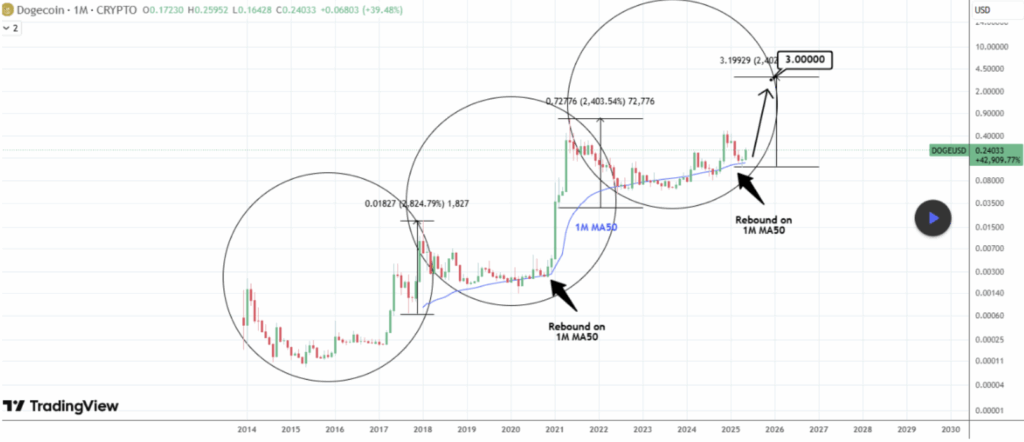
$3 DOGE? The Math Isn’t Crazy
Let’s run the numbers. The 2017 rally did 2,824%. The 2021 one? Around 2,400%. Average that out and apply it to the most recent low at $0.13… you get a target around $3. Not financial advice, but not fantasy either.
Technical indicators on the daily charts back it up too. The Relative Strength Index (RSI) is holding above 64, signaling solid buying pressure. MACD is in the green, and the ADX—used to measure trend strength—is clocking above 32, which usually means things are heating up.
Short-Term Pullback or Just a Setup?
DOGE is currently chilling around $0.2279, after a little dip from recent highs. But honestly? This might just be a healthy retest of the old $0.22 resistance—flipping it into support could be the launchpad everyone’s watching for.
Bottom line: history doesn’t always repeat… but sometimes, it kinda does. And Dogecoin’s latest setup has more than a few chart watchers wondering if we’re about to see it go full circle one more time.


