


- LINK is building bullish momentum, trading around $15.02 and forming an inverse head-and-shoulders pattern, with key resistance at $15.30.
- Technical signals are aligning, including a short-term EMA crossover and a SuperTrend buy signal, pointing toward a possible breakout toward $17.
- On-chain activity is mixed: wallet engagement and transfer volume are up, but exchange netflows have increased—hinting at potential short-term selling pressure.
Chainlink’s been stuck in sideways land for a bit, but it looks like it’s starting to wake up. After a pretty uneventful few weeks, the token’s showing signs of life—trading around $15.02 at the moment, up just a bit (like 0.55%) over the last 24 hours. Nothing crazy… yet.
Still, all eyes are on that $15.30 mark. It’s been a stubborn ceiling, but a few signals are flashing green, and bulls seem ready to make a serious push.

Technicals Are Stacking Up Nicely
Zoom in on the 4-hour chart, and you’ll spot something familiar: yep, an inverse head-and-shoulders pattern forming. The neckline? Right at that $15.30 resistance. If LINK can punch through, that’s a textbook bullish reversal.
Even better, the 9-day EMA just crossed over the 21-day EMA. That’s another sign short-term momentum’s leaning bullish. Still, no breakout = no party. If it gets rejected again, we could be stuck chopping sideways between $14.50 and $15.30 for a bit longer.
On-Chain Signals: A Little Bit of This, A Little Bit of That
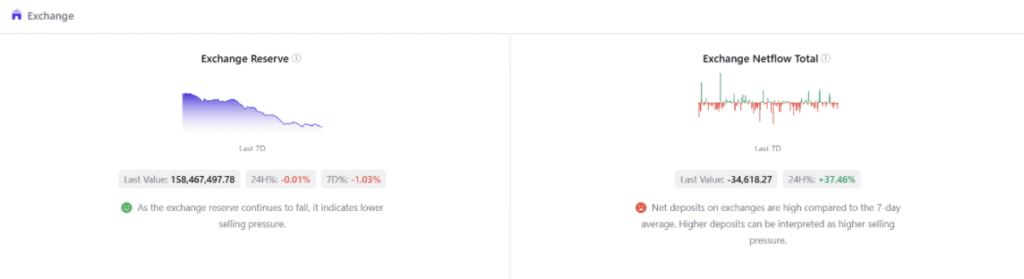
So, exchange reserves have actually dropped around 1% over the past week—always a good sign. It usually means fewer tokens sitting on exchanges ready to be sold.
But—there’s always a but—netflows onto exchanges spiked more than 37% in just 24 hours. That usually means people are moving coins to sell, which might bring some short-term selling pressure.
Kinda mixed vibes here.
Wallets Are Moving, Volume’s Heating Up
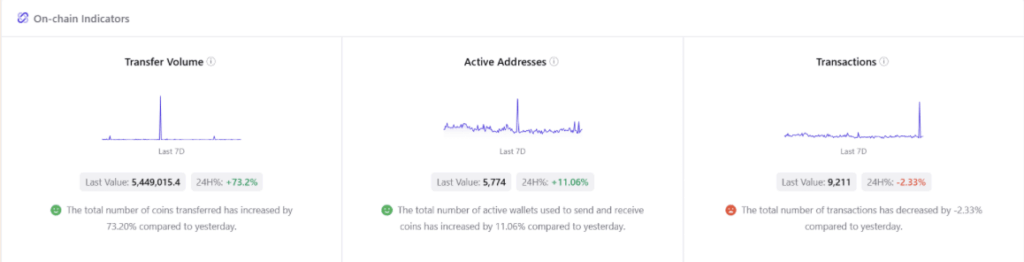
On the positive side of things, wallet activity is up. Active addresses increased over 11%, and transfer volume jumped more than 70%—clearly more people are moving LINK around. That’s bullish. Engagement’s up.
Though… total transaction count did dip a bit (about 2.3%), but eh, that might just be some consolidation noise.
In the derivatives market, things are leaning slightly bullish too. Funding rate’s positive at 0.009%, which means long positions are in control—but it’s still healthy, not overly leveraged. No crazy gambler behavior… yet.
Trend Momentum Says “Let’s Go”
Ali Charts just flagged a new SuperTrend buy signal on LINK’s daily chart. That’s not something to ignore—it usually adds some real weight to bullish momentum when paired with technical breakouts like the one we’re watching.
If LINK can actually close above $15.30 with some decent volume behind it, this could be the start of a bigger trend reversal. Maybe even a ride up toward the $17 zone.
Final Take
So, what’s the vibe? Chainlink’s shaping up for something interesting. You’ve got a classic bullish pattern, moving average crossovers, increasing wallet activity, and even a trend signal confirmation. That’s a lot of green flags.
Still, keep an eye on those exchange inflows—they’re the only real caution light right now.
If $15.30 finally gives way, buckle up. LINK might be ready to stretch its legs and push toward $17 before long.


