


- Solana Surges Past $180: Solana reclaimed $180 for the first time since February, driven by strong DeFi metrics and a 6% gain in 24 hours, with open interest up 11.08%, signaling increased trader confidence.
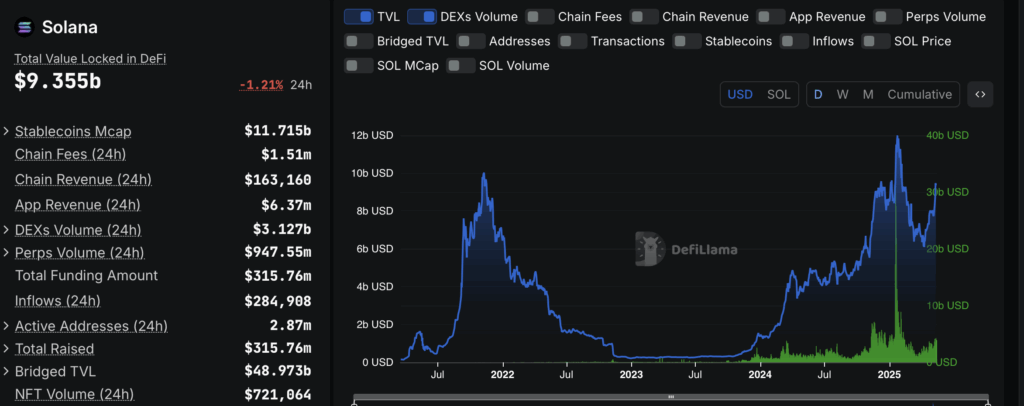
- DeFi and Network Activity Boost: Total value locked in Solana’s DeFi ecosystem rose from $7.5 billion to $9.6 billion, with platforms like Marinade, Jito, and Raydium leading the charge. Meanwhile, weekly DEX volumes jumped from $18 billion to $22 billion, and 65% of SOL remains staked.
- Technical Indicators Signal Mixed Messages: While major EMAs and SMAs show buy signals, the RSI is at 71, suggesting overbought conditions. A breakout above $185 could target $200, but failure to clear resistance may lead to a pullback toward $157 or $130.
Solana’s back in the spotlight, pushing past $180 for the first time since mid-February. A solid technical setup and rising DeFi metrics are behind the 6% gain over the past day and a 22% climb over the past week. According to Coinglass, open interest on Solana has jumped 11.08%, suggesting traders are piling in with fresh contracts – a sign of renewed confidence.
DeFi Ecosystem Gains Ground
Data from DeFiLlama shows Solana’s total value locked (TVL) leaped from $7.5 billion at the start of May to $9.6 billion now. Platforms like Marinade surged 56%, Jito climbed 41%, and Raydium shot up 78%. Meanwhile, weekly DEX volumes jumped from $18 billion to $22 billion, underscoring growing demand.

On-chain activity is buzzing too. Revenues and transaction fees have been trending higher for four weeks straight, closing in on three-month highs. With 65% of SOL staked, the mix of DeFi demand and limited supply could keep prices propped up.
Not All Metrics Shine
Still, it’s not all good news. Solana’s stablecoin market cap slipped by 8% over the last seven days, now sitting at $11.7 billion. And with a funding rate of 8%, traders are paying a premium to hold longs – a bullish signal that often precedes a pullback.
Technical Setup – Green Lights and Red Flags
From a technical perspective, SOL is trading comfortably above all major EMAs and SMAs – 10, 20, 50, 100, and 200-day averages – all flashing buy signals. That’s bullish. But the RSI is up at 71, suggesting overbought conditions that might invite some profit-taking.
The Bollinger Bands are spreading out, indicating higher volatility. SOL’s hovering near the upper band at $185, a key resistance level. If it breaks through, the next target is $200. But if it stalls here, support sits around $157 (20-day EMA) and $130, where the lower Bollinger band and prior consolidation zone align.
Looking Ahead – Path to $200?
If SOL can punch through $185 with solid volume, the door to $200 swings open. But if the breakout fails, expect a pullback to support zones. Despite being 39% below its all-time high of $295, momentum is building, and with institutional interest growing, upcoming upgrades like Firedancer could fuel the next leg up – as long as market conditions cooperate.


