


- BONK remains stuck in a descending channel, with recent rejections at resistance and weak buying volume suggesting the bearish trend is still in control.
- The RSI has climbed above 50, hinting at short-term bullish momentum, but the lack of rising OBV shows demand hasn’t returned in any meaningful way.
- Key levels to watch are $0.0000113 and $0.000014, with a bounce from mid-channel support possible — though traders are advised to follow the trend, not chase the pump.
The memecoin madness that once fueled BONK’s wild rise seems like a distant memory. Lately, the chart’s been telling a pretty grim story — especially on the 1-day timeframe. BONK’s been sliding, clinging to the $0.0000099 level, which has already been tested twice in the past month.
That same level? It was key support way back in January 2024. And if the current trend doesn’t break soon, BONK might just blow past its 2024 lows… and not in a good way.

Trying to Find a Bottom — But It’s Slippery Down There
Zooming out a bit — since March, BONK’s been trapped inside a descending channel, and it’s sticking to the script. The mid-line of that channel (that dotted white line on the chart) has acted as both support and resistance depending on BONK’s mood.
Just this past Sunday, BONK got rejected at the top of the channel, and now the next logical step is — yep, a move back toward that mid-line. So far, it’s playing by the textbook.
Now, here’s the twist: the RSI climbed above 50 last week. That usually hints at bullish momentum, or at least a flicker of it. But let’s not get too excited — it’s not clear whether that move’s got staying power or if it’s just a blip in an otherwise bearish trend.
Volume’s Not Backing It Up (Yet)
The real problem? No demand.
The On-Balance Volume (OBV) — a key tool for sniffing out whether buyers are actually showing up — is still stuck near February and March lows. So even though price bounced off support last week, it doesn’t look like anyone’s truly aping in.
Translation? The bounce might not be the real deal. If you’re trading this thing, those little upward moves could actually be solid short entries.
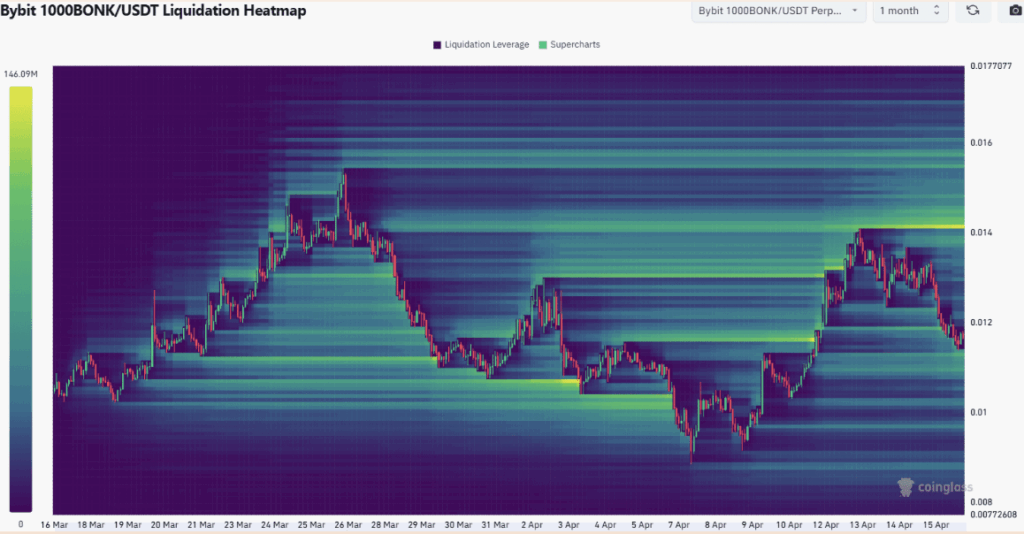
Heatmap Says Watch $0.0000113 — and Maybe $0.000014
Peeking at the liquidation heatmap (thanks, Coinglass), there are two zones traders should keep an eye on.
The first one’s $0.0000113 — not far from current price levels. It’s not a super-dense cluster, but it’s close enough to attract short-term action. The second level is $0.000014, and that one? It’s got more heat — and it lines up with the top of the descending channel.
So, if BONK can bounce off the mid-channel support (right around $0.000011), there’s a shot it might push toward $0.000014. But remember — that would just be a test of resistance. Not a breakout. At least not yet.
Final Thoughts — Play the Trend, Not the Hype
Bottom line: market structure is still bearish, and there’s not enough buyer strength to shift things — at least not right now.
Traders? Best to wait for a bounce, then look to ride the trend lower until there’s a real structure break. BONK might try to rally from the $0.000011 zone, but unless buying volume seriously picks up, it’s probably just another lower high in a long-term downtrend.
Don’t get faked out by the frog — not just yet.


