


- BNB has shown a strong upward trend, moving from $630 to over $685 since May 20, supported by higher trading volumes and growing open interest, signaling bullish momentum.
- Volume surged during recent rallies, with BNB closing at $681.68 on May 27. Increased activity during upward moves suggests active buyer participation and possible continuation toward the $700–$750 resistance zone.
- Technical indicators remain bullish, with the MACD flashing a crossover and the price holding well above key Bollinger Band levels. If momentum holds, BNB could see further upside, provided it maintains support around $624–$630.
It’s been a lively week for BNB, with the token clawing its way up the charts and sparking a new wave of interest. Despite a few dips here and there, the general vibe is that bulls aren’t done just yet. With prices holding firm and momentum picking up, market watchers are starting to ask: is this thing getting ready to pop past resistance?
Hourly Trends Show a Steady Climb… With a Few Wobbles
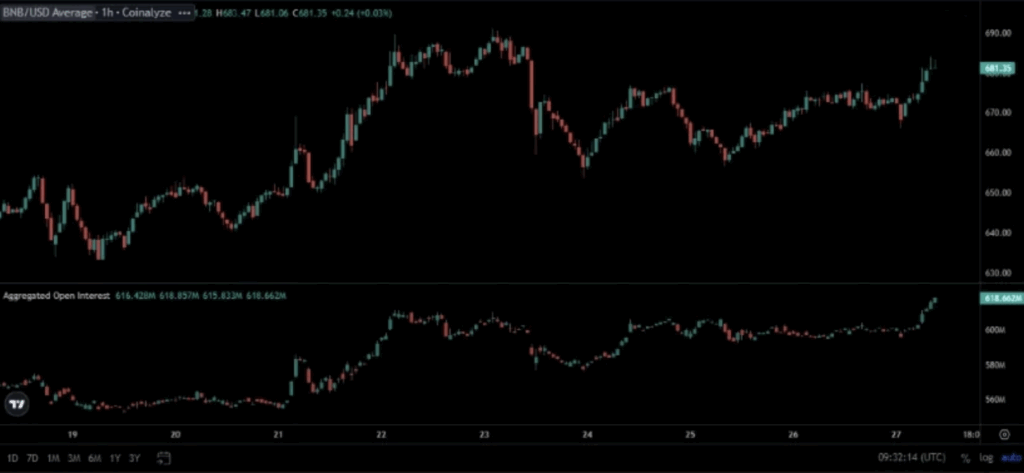
Zooming into the 1-hour chart on Coinalyze, BNB started showing signs of life around May 20. The token moved from the $630 range and punched through to just over $685—not too shabby. It wasn’t a straight shot, though. May 22 to May 24 saw some turbulence, but higher highs and higher lows kept the trend in good shape.

By May 27, BNB was hanging around $681—testing levels it hadn’t touched since its last consolidation phase. And under the hood, the open interest numbers told a bullish story too. It went from under $580M to nearly $619M, pointing to growing interest and leveraged plays.
Volume Picks Up as Bulls Step In
On May 26-27, BNB started the day near $672, dropped just a bit under $668, and then bounced hard to finish at $681.68. That’s a 1.13% gain for the day—not massive, but solid. What stood out, though, was the volume. Nearly $730M in trading took place during the session, close to the 24-hour total of $770.42M. The fact that activity jumped during the rally hints that buyers were serious.
With BNB flirting with the $682 level, all eyes are on whether it can push past that resistance. If volume keeps up, that move might not be far off.
Technicals Suggest the Trend Isn’t Done
On the weekly timeframe, things are still looking pretty bullish. BNB’s trading well above the Bollinger Band midpoint of $624.96 and not far from the upper band at $703.59. That kind of positioning often shows a medium-term uptrend. Green candles stacking up week after week? Yeah, that’s a sign of steady demand.
The MACD chart is adding to the optimism, too. It just flashed a bullish crossover, and the histogram is turning green—signals that buyers are gaining ground again after a sluggish period.
Looking ahead, the $700–$750 zone is going to be a battleground. If BNB can stay strong above $624–$630, it might just build the base it needs to push higher. For now, it’s got the setup—what it needs next is follow-through.


