


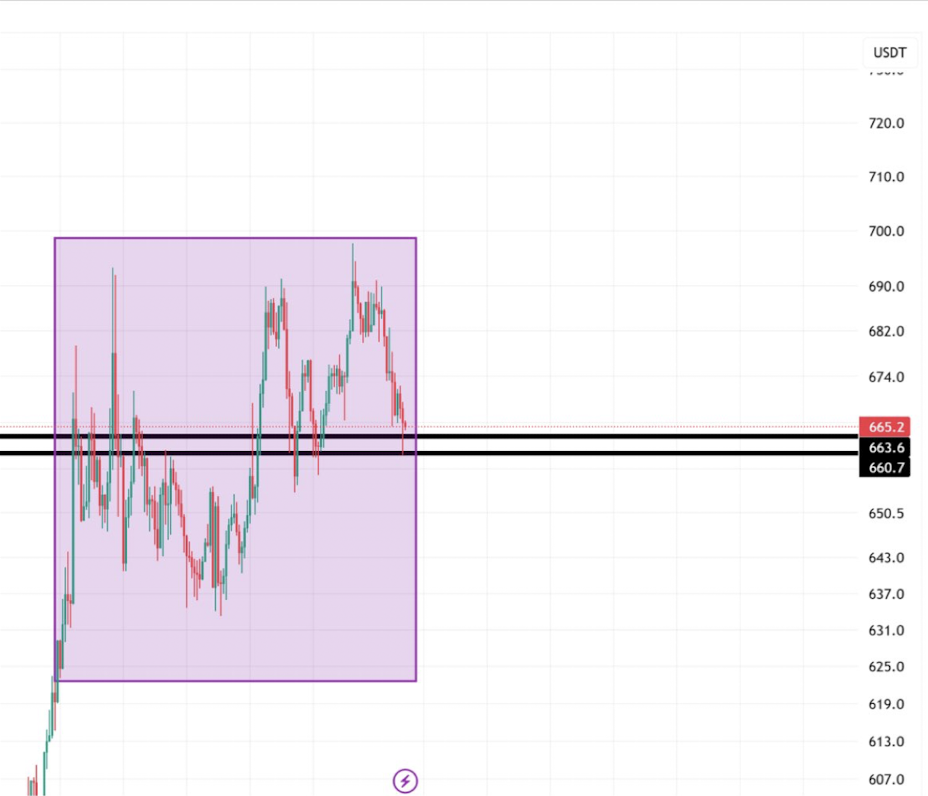
- BNB is trapped in a tight range between $660 and $700, with analysts watching for a breakout above resistance or a breakdown below support to signal the next move.
- Short-term weakness is evident, as price slipped to $653 with low trading volume, but long-term fundamentals and ongoing token burns continue to support its value.
- Weekly indicators hint at bullish momentum, with a MACD crossover and price holding above key moving averages, but confirmation is needed via a strong close above $700.
The Binance Coin (BNB) chart’s showing signs of pressure and potential. After hovering around $665, the coin’s pressing against the upper resistance at $700—a level that’s been stubbornly rejecting any real breakout so far. According to multiple analysts, the range between $660 and $700 is now a critical “squeeze zone,” and price action here could determine BNB’s next move. Momentum indicators on longer timeframes are flashing green, suggesting that if bulls get it right this time, things could heat up fast.
Technical Tightness Creating Defined Risk Zones
A well-defined range—between $660 and $700—has shaped up on BNB’s daily chart, signaling ongoing accumulation or indecision. The $660 level’s held firm as demand has repeatedly stepped in after dips. If price cracks $700 with solid volume behind it, analysts say a move to $740–$780 could be next. But if support fails and $660 gives way, BNB might tumble down toward the $620 region. It’s a tight setup—traders are watching closely for a breakout confirmation, or a deeper pullback.

Short-Term Weakness Meets Long-Term Strength
BNB recently slipped to $653 after getting knocked down from $670. Trading volume also cooled to around $875 million—pretty light for this coin. This could just be calm before the storm, though. While short-term demand seems soft, BNB’s still a top-5 asset with strong fundamentals: it fuels the Binance ecosystem, benefits from regular token burns, and has real-world use cases across DeFi. Long-term sentiment seems steady, but bulls need fresh buying to punch through the current ceiling.
Weekly Indicators Flash Cautious Optimism
Zooming out, the weekly chart is sending mixed signals, but momentum’s slowly picking up. The MACD’s bullish crossover near the zero line is a positive shift, and BNB’s floating above its Bollinger Bands basis line at $623. A strong weekly close above $700 would likely flip the bias to bullish and open up targets in the $740–$780 range. But if the price stumbles and closes below $623, the bullish setup could break down. Basically—it’s close, but not there yet. Bulls need follow-through or risk fading back into consolidation.


