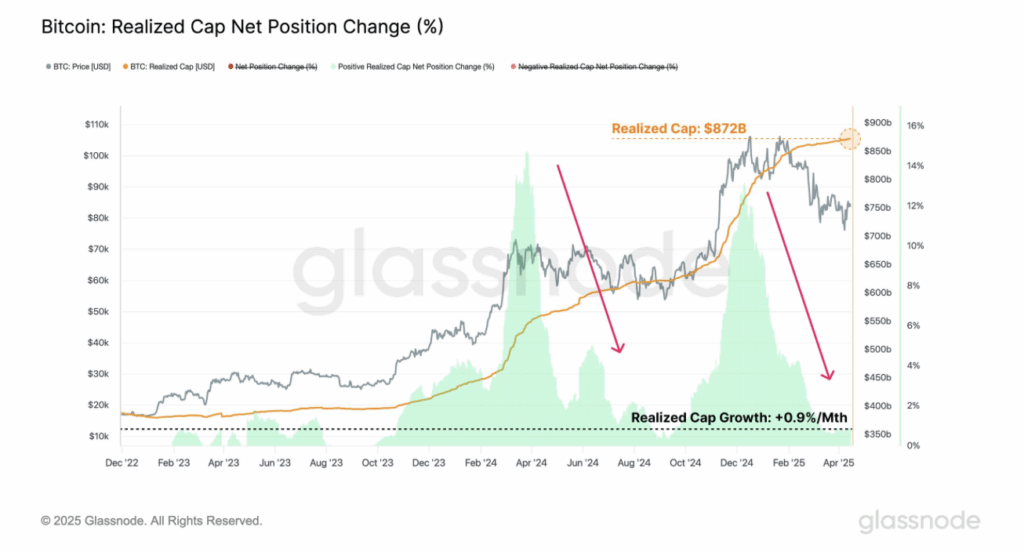
- Bitcoin’s realized market cap hit a record $872B, but slow monthly growth (0.9%) and a sharp drop in realized profits suggest low investor enthusiasm and cautious sentiment.
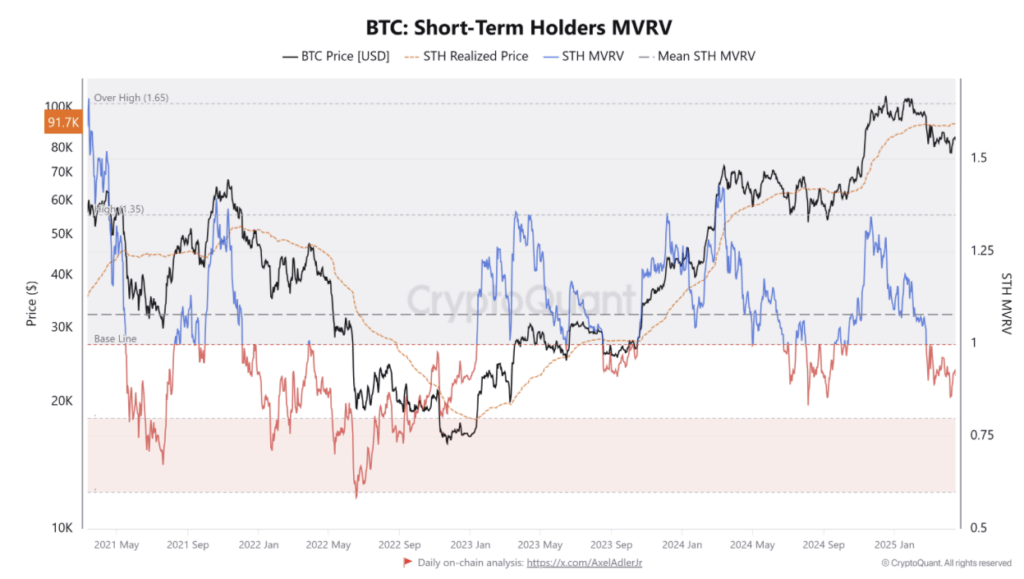
- Short-term holders are mostly underwater, with a realized price around $91,600 and an MVRV ratio below 1 — both pointing to potential selling pressure and possible buying opportunities.
- US traders are showing stronger demand than Korean traders, while BTC trades in a tight range ($85.4K–$82.7K) and faces resistance on the daily chart despite short-term support.
So, here’s the thing — Bitcoin’s realized market cap just hit an all-time high of $872 billion. Sounds bullish, right? You’d think traders would be buzzing. But according to the data — not so much.
Despite this milestone, sentiment across the board looks… well, kind of hesitant.
Investors Aren’t Rushing In — Here’s Why
According to Glassnode, the monthly growth rate of Bitcoin’s realized cap has slowed to just 0.9%. That’s not zero, but it’s definitely not impressive either. And for context — realized cap isn’t just about hype or headlines. It measures the total value of BTC based on the price it was last moved. So, it’s a more grounded take on how much money’s actually flowing in.
A slowdown here? That typically screams “risk-off mood.”
Fewer new investors. Less movement from the current crowd. People are either chilling or playing it safe — probably both.

Profit-Taking’s Kicking In, and It’s Dragging Momentum
Glassnode also pointed out a 40% drop in realized profit and loss. That’s a big dip. What it tells us is: a lot of people either locked in profits or ate losses — and now, they’re on the sidelines. Historically, these moments of saturation often come right before a consolidation phase.
Basically, the market’s taking a breather — trying to find its next direction.
Short-Term Holders Feeling the Heat
It gets even more interesting (and slightly uncomfortable) when you look at short-term holder data. CryptoQuant reports the current short-term realized price is around $91,600 — which means, with Bitcoin trading below that, most of these newer holders are underwater.
If price keeps hovering here, some of them might start panic selling to cut losses, adding pressure to the downside.
On top of that, Bitcoin’s MVRV ratio for short-term holders is still under 1. Historically, that’s been a sign that these traders are holding at a loss — but ironically, it’s also flagged buying opportunities in the past. Depends on your risk appetite.

East vs. West: Diverging Trader Sentiment
Here’s a fascinating angle — US vs. Korea.
In the US, the Coinbase premium just spiked, suggesting strong buying demand. That’s usually a bullish signal — traders there are feeling confident.
But over in Korea, it’s the opposite story. The Kimchi premium dropped during the recent dip, showing less retail interest from Korean investors.
This mismatch in demand? You can see it playing out in the charts. Bitcoin has been bouncing inside a pretty tight range — between $85,440 and $82,750 — ever since April 11.
Mixed Signals from the Charts
On shorter timeframes, BTC is still holding up well — it’s sitting above the 50-day, 100-day, and 200-day moving averages on the 4-hour chart. So short-term traders might still be in the game.
But on the daily chart, those same moving averages? They’re acting as resistance — putting pressure on any larger bullish move.
So right now, Bitcoin’s stuck in this weird middle zone. Strong fundamentals, but nervous sentiment. Bullish structure, but cautious traders.
Final Thoughts
Bitcoin’s realized cap hitting a record high sounds great on paper — but real-time investor behavior tells a more nuanced story. With short-term holders underwater and global sentiment split, BTC may need more time (and maybe a catalyst) before making a decisive move.
Until then, traders might want to stay nimble. The big breakout could be coming — but we’re not there just yet.


