


- Bitcoin Breaks $100K: Bitcoin surged past $100,000 on May 9, hitting $104,150 for the first time since February, fueled by a $925 million liquidation wave, mostly from short positions.
- Technical Analysis – Overbought Yet Supported: Despite the RSI signaling overbought conditions, BTC remains supported by multiple moving averages and a bullish MACD crossover, with analysts eyeing $106K and $109K as key resistance levels.
- Bullish Targets and Long-Term Outlook: Analysts project further gains, with AlphaBTC targeting $106K, Egrag Crypto aiming for $170K, and Binance CEO CZ speculating on a potential surge to $500K–$1M amid institutional interest and government accumulation.
Bitcoin (BTC) is back in the six-figure club. After months of range-bound trading, BTC surged above $100,000 on May 9, hitting $104,150 during the late New York session. That’s the first time it’s touched six figures since February 4, driven by a fresh wave of liquidity and a major short liquidation.
Liquidity Wipeout Fuels BTC Rally
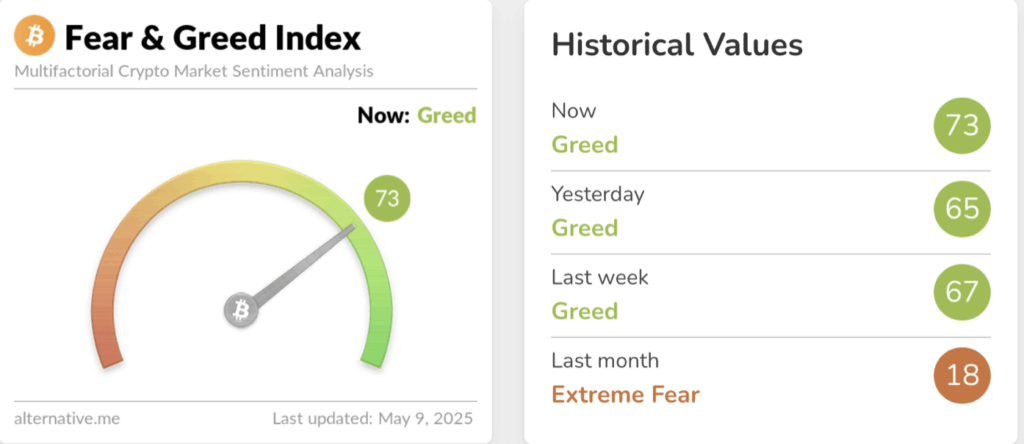
The spike wasn’t just a gradual climb. BTC wiped out over $925 million in liquidations within 24 hours, with $800 million of that coming from short positions, marking the largest short squeeze since 2021, according to CoinGlass. As a result, the Crypto Fear & Greed Index shot up from 65 to 73, showing a rise in market greed.

Interestingly, there’s still significant seller interest sitting around the $109,500 level, with ask-orders worth $2.85 billion. That suggests this rally might still have some steam left in it, at least in the short term.
Technical Analysis — Overbought, But Supported
Crypto analyst GemXBT points out that BTC is looking a bit overheated on the daily chart. The Relative Strength Index (RSI) is now above 70, a classic overbought signal. But the Moving Average Convergence Divergence (MACD) indicator remains above the signal line, and BTC is still trading comfortably above the 5MA, 10MA, and 20MA — a strong bullish alignment.
“Bitcoin (BTC) is currently in an uptrend, supported by multiple moving averages and a bullish MACD crossover,” GemXBT notes. “Still, that RSI reading suggests caution.”
BTC Price Targets — What’s Next?
Analysts are now eyeing some ambitious targets for Bitcoin. AlphaBTC, a popular trader, suggests that BTC could extend this run to $106,000, based on Fibonacci retracement levels lining up with key support zones. “I’m liking how these Fibonacci levels align — makes me think $106K+ is on the cards before a correction,” he said.
Other traders are even more optimistic. Egrag Crypto, another crypto analyst, is targeting $170,000, provided BTC can close above its previous all-time high of $109,000. “If we don’t break above $109K, it’s just a bull trap. If we do — $170K is possible,” he stated.
And then there’s Binance CEO Changpeng Zhao, who’s looking far beyond. Zhao recently suggested that Bitcoin could hit between $500,000 and $1 million during this bull cycle, fueled by institutional buying, government accumulation, and a pro-crypto stance from the US under President Trump.
Bull Flag Targets $180,000
From a technical perspective, Bitcoin has formed a bull flag pattern on the weekly chart, with the breakout occurring on April 22 when BTC surged above $88,000. If this pattern plays out, the upside target is around $182,200 — a 75% gain from current levels.
“The bull flag breakout is real, and the target is clear. Now it’s about maintaining momentum and not falling back below $88K,” AlphaBTC noted.
Key Levels to Watch:
- Support: $88,000, $100,000
- Resistance: $106,000, $109,000, $170,000
- Breakout Target: $182,200
As always, keep an eye on those liquidation zones and watch for volume confirmations. This rally may have legs, but overbought signals are starting to flash, so proceed with caution.


