


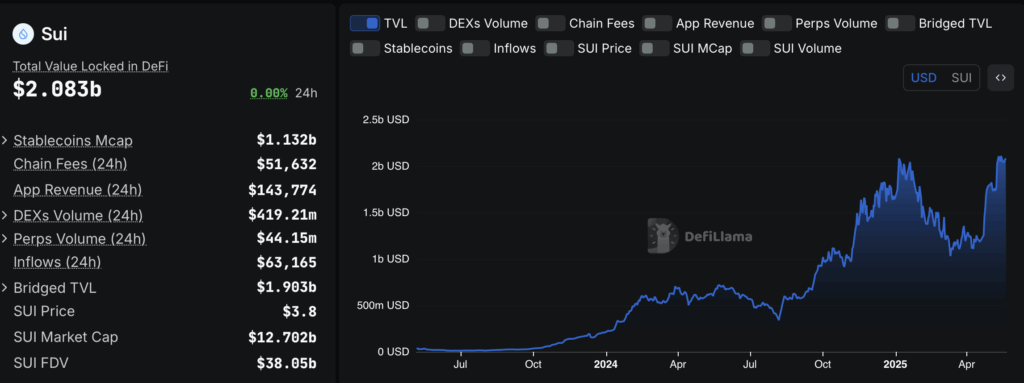
- Strong Fundamentals: Sui recorded $9.3M in fund inflows last week and saw its DeFi TVL rise above $2B. Stablecoin market cap jumped 23.5%, and DEX volume hit $4.14B.
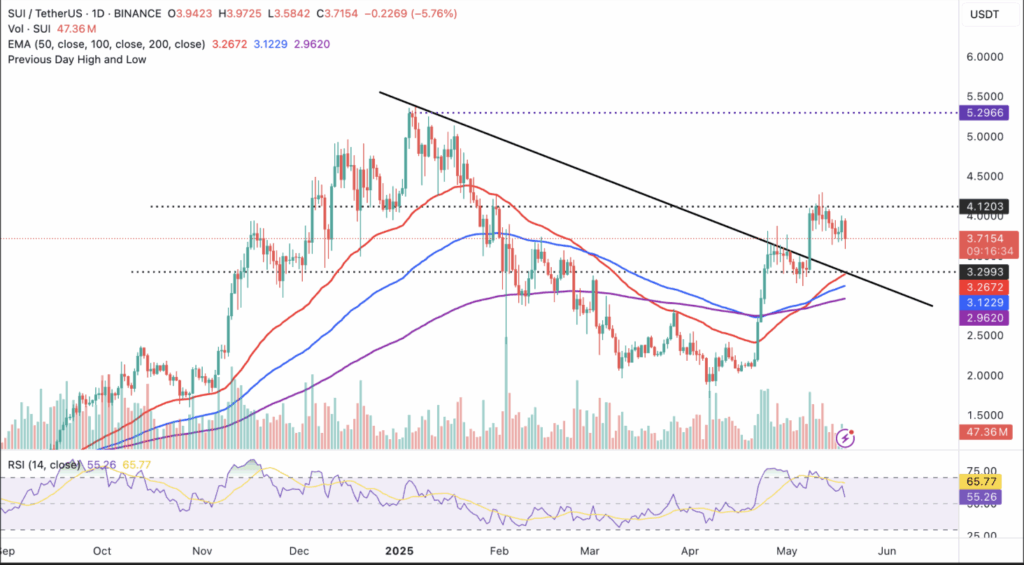
- Current Price Action: SUI is trading around $3.71, down over 6% on the day, with RSI falling from overbought levels — signaling short-term bearish momentum.
- Support & Trend: Key support lies at $3.50 and $3.26, with longer-term EMAs still rising; the overall trend remains bullish if SUI holds above those moving averages.
Sui (SUI) has been facing some resistance around $3.71 on Monday, coming off a slightly bullish weekend. After that sentiment-fueled jump to $4.30 back on May 12, the token’s been stuck below the $4 mark — even with steady fund inflows.
Bullish Sentiment, But Price Stalls
According to CoinShares, Sui pulled in $9.3 million in digital asset fund inflows last week. Not bad, but it still trails behind the big guys — XRP has $1.42B in AUM, and Solana’s at $1.6B, while Sui sits around $332 million.

Across the board, digital asset products saw $785 million in inflows, marking five weeks straight of gains. Bitcoin took the biggest slice ($557M), and Ethereum racked up $205M thanks to fresh optimism around the Pectra upgrade.
Sui’s fund inflows align with steady growth in its DeFi TVL (Total Value Locked), which is now sitting just over $2 billion. That’s up from $1.78 billion at the start of May — a good sign, showing confidence in the ecosystem. Rising TVL typically means people trust the protocol and expect future upside.
Stablecoins and DEX Volume Climb
Sui’s stablecoin market cap jumped 23.5% last week, hitting $1.09B, mostly thanks to USDC. Decentralized exchange (DEX) volume also popped off — up 10.47% to $4.14B in weekly trades. These are all solid signs that user activity is climbing.
Where’s SUI Headed Next?
Right now, SUI is down over 6% on the day, sitting around $3.71. It even dipped to $3.59 earlier Monday. The RSI has been falling too, now closing in on the 50 mark after being way overheated (75.53) on May 8. This slide in RSI lines up with the drop from the recent $4.30 high — showing sellers still have the edge, at least for now.
Key support to watch? $3.50 (already tested before), then $3.26 (near the 50-day EMA), and further down around $2.96 at the 200-day EMA.
Big Picture: Caution, But Not Panic
Short-term, it’s a bit choppy. But SUI’s still holding above its key moving averages: 50-day at $3.26, 100-day at $3.12, and 200-day at $2.96. Those are all trending upward, which usually means bulls aren’t out of the game yet.
So yeah, it might look a little bearish in the short term, but zooming out? The structure still favors buyers — as long as those EMAs hold.


