


- AVAX Consolidation and Potential Reversal: Avalanche (AVAX) is stabilizing after a prolonged correction, with key support around $18.30–$19.00 and resistance at $24.16. A bullish divergence in the RSI hints at a possible bounce, but failure to hold support could lead to a retest of the $14.37 low.
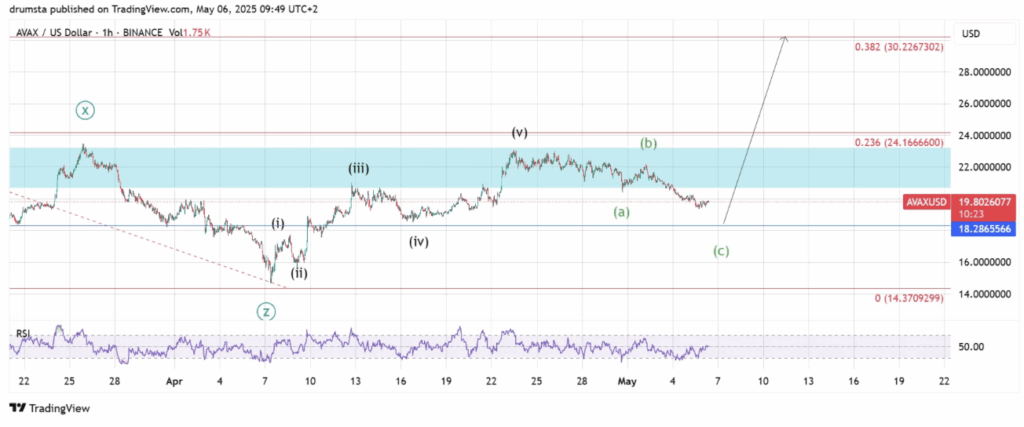
- 1-Hour Chart Breakdown: AVAX completed a five-wave impulse move, peaking above $24, followed by a textbook A-B-C correction. If the $18.30 support holds, a rebound could target $24.16 and potentially extend to $30.22 and $35.12 (Fibonacci levels).
- Key Levels to Watch: Support zones at $18.30, $16.50, and $14.37 remain crucial, while resistance at $22.80, $24.16, and $30.22 will determine the next breakout direction. A confirmed higher low with strong volume above $24 could signal a bullish continuation.
Avalanche (AVAX) has been in consolidation mode after a lengthy correction that dragged its price down to a crucial multi-month support zone. From a broader perspective, AVAX just completed a complex W-X-Y-X-Z pattern, and now the price action is hinting at a possible bottoming phase.
Technical Overview – Multi-Timeframe Analysis
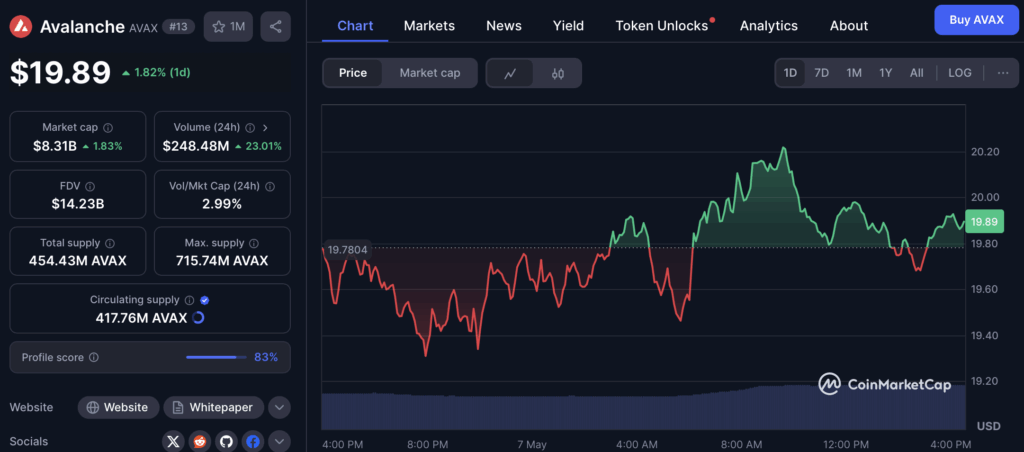
Zooming out, AVAX has been trapped in a downtrend since peaking near $55 back in December 2024. That descent unfolded as a multi-wave corrective pattern, finally bottoming out at $14.37 on April 7th. Following that, the price staged a five-wave recovery but has since pulled back, finding support in the $19–$20 zone — a level that’s been a pivotal area throughout 2023 and 2024.

The key zone between $18.50 and $24 has been repeatedly tested and continues to hold significance. Recently, price was rejected below the 0.236 Fibonacci retracement at $24.16, failing to maintain the breakout. However, there’s still some hope — price is consolidating above the prior swing low of $18.28, aligning with the base of the current support structure.
RSI Shows Divergence, But Will It Hold?
On the 4-hour chart, the Relative Strength Index (RSI) is flashing a bullish divergence, a setup that often precedes a bounce. But it’s not a done deal yet. AVAX needs to reclaim the $22–$24 range to confirm bullish momentum. Volume is still relatively light, so any breakout attempt will need strong buying interest to push through resistance.
If support around $18.30 gives way, though, things could get dicey. The next target would be the March low at $14.37 — a level that, if breached, could invalidate the bullish recovery setup.
Zooming In – 1-Hour Chart Breakdown
Looking closer at the 1-hour timeframe, AVAX completed a clear five-wave impulse move from the April low, peaking just above $24 in late April. Since then, it’s been unwinding in a classic A-B-C correction.
- Wave A knocked the price down to $20.40.
- Wave B managed a weak bounce to $22.80.
- Wave C is currently unfolding, with price action eyeing the $18.30 support zone.
This area is critical — it’s not just a horizontal support level but also a psychological round number and a demand cluster that previously triggered impulsive moves. RSI is climbing off oversold territory, forming a bullish divergence with price, suggesting that the selling pressure might be easing.
Next Potential Moves
If AVAX holds the $18.30–$19.00 range and reclaims the previous wave B high at $22.80, a new impulse wave could kick off. Initial targets would be the 0.236 Fib at $24.16, with further extensions toward $30.22 (0.382 Fib) and $35.12 (0.5 Fib).
However, a breakdown below $18.30 would open the door for a slide toward $16.50 and possibly the $14.37 low.
Key Levels to Watch
- Support: $18.30, $16.50, $14.37
- Resistance: $22.80, $24.16 (0.236 Fib), $30.22 (0.382 Fib), $35.12 (0.5 Fib)
- Confirmation: A higher low, coupled with strong volume above $24, could signal a bullish trigger for a potential run toward $30 and beyond.


