


- SUI’s head-and-shoulders breakdown suggests a potential 20–25% drop unless bulls reclaim $3.10; an ascending triangle offers a shot at $4.10 if reversed.
- SOL’s descending triangle pattern points to a possible breakdown to $110, with weak RSI and resistance capping upside moves.
- SUI may have better recovery potential than Solana, depending on whether key support zones hold and attract buyers back in.
Layer-1 tokens like Sui (SUI) and Solana (SOL) haven’t had the best start to June. SUI’s down about 14.5% so far, and SOL has shed 6.5%—both underperforming most of the altcoin market. And based on how the charts are shaping up, things might get a little rougher before they get better.
Let’s unpack what’s going on with these two Ethereum rivals—and whether there’s a shot at a bounce later down the line.

SUI Could Dip Another 20% If Bears Stay in Charge
According to analyst NebraskanGooner, SUI’s setup is looking… not great. He pointed to a head-and-shoulders pattern that’s now broken down, which tends to be a bad omen for prices. “Rejected key resistance and now back below the 99 SMA,” he noted, adding that things are lining up for a possible drop to the $2.20 area.
After failing to hold above $3.25, SUI slipped back under its 99-day moving average. That rejection coincides with the H&S breakdown, and based on technicals, we might see another 20–25% drop from current levels by July.
Now, if bulls manage to flip the $3.00–$3.10 range back into support, that’d throw a wrench in the bearish setup. In fact, it could signal a shift to a broader ascending triangle structure—which tends to be bullish. If that plays out, SUI might rally toward $4.10, which would be a solid 45% jump from where we’re at now. But again, that’s if it can reclaim lost ground.
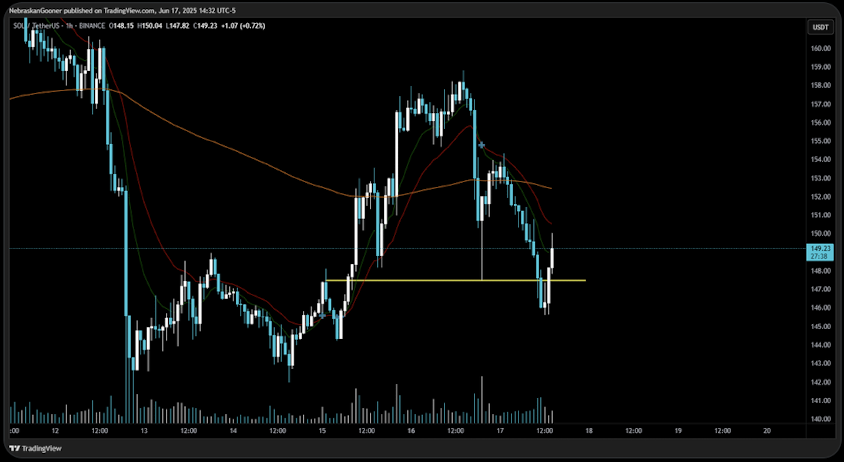
Solana’s Chart Points to a Potential Breakdown to $110
Solana’s not looking too hot either. It’s stuck inside a descending triangle—a bearish setup—with its support hovering between $142 and $145. Right now, it’s clinging just above that support zone, but the lower highs from May are adding pressure.
If price breaks below that base, the pattern suggests SOL could fall to around $110—a 25% haircut. Adding to the bearish tone, SOL’s trading under both its 50-day and 200-day exponential moving averages, while the RSI hovers weakly at 43. That’s not a ton of bullish energy.
Still, there’s a slight chance things flip. If SOL bounces off that support cleanly, the triangle might actually morph into a falling wedge—a reversal pattern, not a continuation one. In that case, SOL could target $173.65, a 17% upside from here. But that bounce needs to be convincing.
TL;DR? SUI’s Got More Upside Potential—If It Can Hang On
Both SUI and SOL are facing their fair share of bearish pressure right now. But SUI’s chart shows more flexibility—if buyers step in. Solana, on the other hand, needs a clean bounce fast, or the path to $110 is wide open.


