


- Fartcoin’s stuck in a sideways range after failing to break the $1.5 resistance but holding strong above $1.
- Weekly OBV shows accumulation and suggests long-term traders are still interested.
- A breakout in OBV or RSI strength could trigger a push back toward $1.5 — worth watching.
Fartcoin (yep, that’s the name) made some noise back in April and May, running up fast before hitting a wall at the $1.5 resistance. Since then, things have cooled off a bit. The memecoin’s been ranging sideways, but with Bitcoin still hanging tough above $102.5K and inching toward new highs, some are wondering — is FARTCOIN gearing up for round two?
Weekly Chart: Still Holding Ground
Looking at the weekly chart, the vibes are mixed. Price action hasn’t been all that exciting lately. After a wild ride in January, where FARTCOIN popped and then dropped all the way down to $0.21, things did start to pick back up. From that low, it rallied over 630% in just 70 days. Sounds crazy — but even with that push, the coin hasn’t cracked its 50% retracement barrier.

It hit the wall at $1.47 again last week. That’s been the ceiling since May. But here’s something positive — the $1 psychological support level held firm during early June’s dip. Plus, the On-Balance Volume (OBV) is climbing, hitting higher highs compared to earlier this year. That’s a hint the long-term bulls aren’t gone yet.
Daily Chart: Possible Buy Zone Forming?
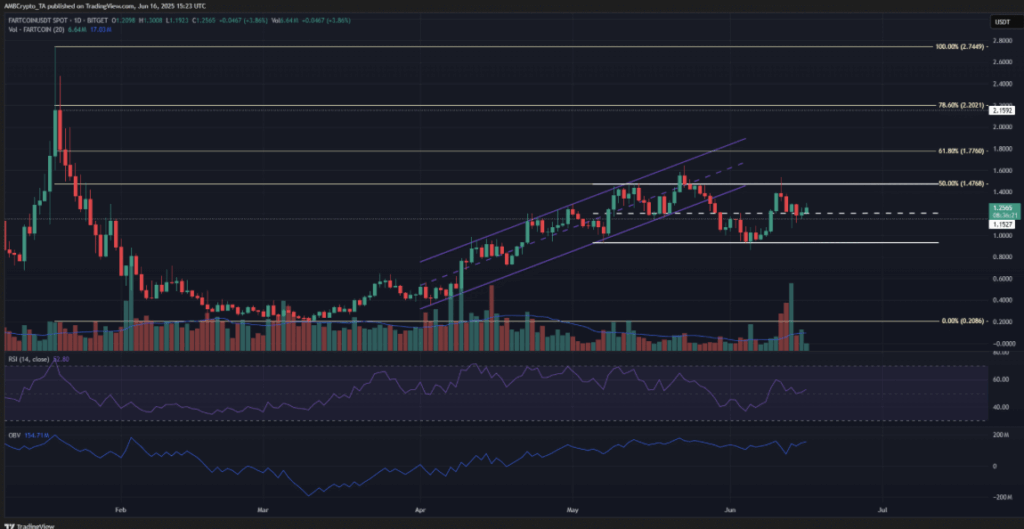
Now zoom into the daily chart and things get a bit more interesting. Fartcoin bounced nicely off the $0.4 area and formed a rising channel (shown in purple, if you’re peeking at charts). But it couldn’t break above $1.5 — again — and slid back under the channel, retesting support at $0.92.
That area’s looking like a legit demand zone now. Price rebounded quickly toward the $1.47 high again, although the trading volume didn’t exactly explode. OBV’s kinda flat too, hovering near its May highs without a clean breakout yet.
Bottom line: we’re likely in a range setup now. The memecoin’s bouncing between $0.9 and $1.47, and unless we see some serious volume, this ping-pong action might continue for a bit. Watch the OBV — if it finally pops higher, that could be your signal that price is ready to move again.
The RSI also bounced off the 50 line recently, and price is hanging around that $1.2 mid-range level. For swing traders, this might be a decent entry to aim for a move back into the $1.4–$1.5 resistance pocket.


