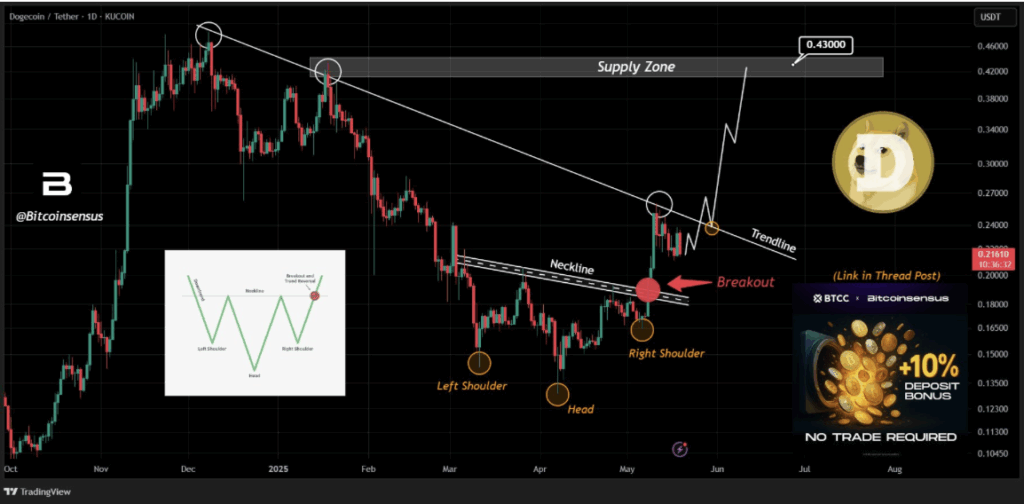
- Bullish Patterns Forming: DOGE has broken above an inverse head and shoulders neckline and is testing a long-term descending trendline; a breakout could trigger an 89% rally toward $0.42–$0.43.
- Additional Setup: A developing bull flag suggests consolidation before a possible continuation of the uptrend if volume picks up.
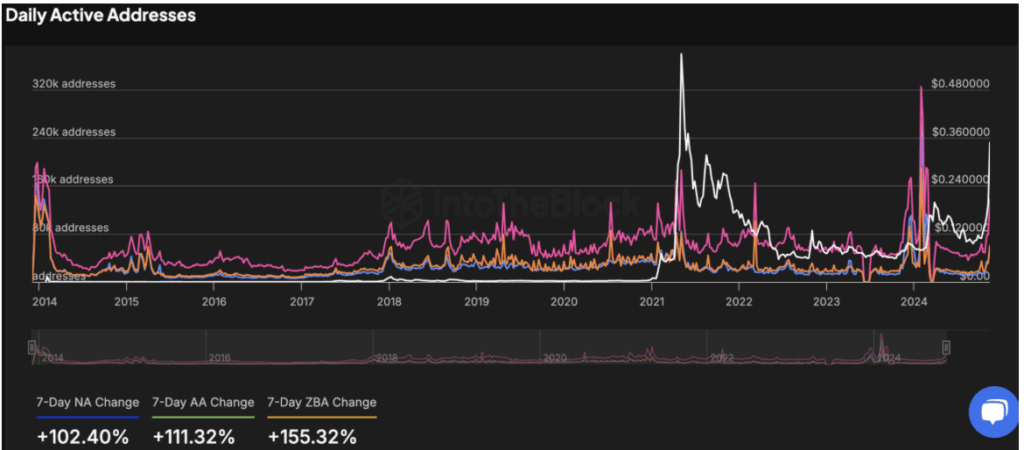
- On-Chain Surge: Daily Active Addresses, including new and zero-balance wallets, have spiked—historically a sign of growing demand and potential price gains.
Bitcoinsensus has spotted a potential uptrend for Dogecoin (DOGE), pointing to a key descending trendline and a breakout above an inverse head and shoulders neckline. This could set the stage for a stronger bullish move — if a few more signals line up.
DOGE Price Action and Bullish Reversal Structure
After a rocky week, DOGE tapped a local high near $0.24 on May 14 before slipping to around $0.21. As of now, it’s bounced back to trade at $0.227. In the middle of all that price noise, analysts noticed some interesting formations taking shape.
On Dogecoin’s daily chart, a textbook inverse head and shoulders pattern seems to be completing. The setup kicked off back in early March around $0.15, with the head forming during April’s deeper dip and the right shoulder appearing later that month as prices rebounded.
The neckline—sloping downward just a bit—was a tough resistance to crack. But DOGE finally broke above it, hinting that the bears might be losing steam. That said, it’s not out of the woods yet. The memecoin is bumping into a long-term descending trendline that’s been shutting down rallies since late 2024.

Next Steps: Breakout or Breakdown?
DOGE has been rejected multiple times at this trendline—once at $0.46 in December and again at $0.42 in January. After the January rejection, it tumbled all the way to $0.135. Now it’s retesting that same trendline. If it breaks out cleanly, retests, and confirms, DOGE could rocket toward the $0.42–$0.43 supply zone. That’s an 89% move from current levels.
Bull Flag Pattern Adds to Bullish Case
Adding more fuel to the fire, another bullish formation is showing up. Trader Jake Wujastyk spotted a bull flag pattern on the charts. It’s that classic formation where price rallies sharply, then drifts downward in a tight range — forming the flagpole and flag.
In this case, the pole came from a move up near $0.25. Since then, DOGE has been consolidating between $0.251 and $0.201. If it pops above the upper boundary of the flag, especially with some volume behind it, that could confirm continuation of the uptrend.

On-Chain Activity Supports the Move
Backing up the bullish setups, on-chain data is flashing green. IntoTheBlock reports a big spike in Dogecoin’s Daily Active Addresses, including new users and zero-balance wallets.
Over the past week:
- New Addresses jumped 102.40%
- Active Addresses rose 111.32%
- Zero Balance Addresses increased 155.32%
Historically, these surges in activity have shown up right before DOGE price rallies. It suggests more users are jumping in, which could add fuel to any technical breakout in the coming days.
Final Thoughts
All signs point to a major move for Dogecoin — if, and it’s a big if, it can break through that stubborn descending trendline. Between the inverse head and shoulders pattern, the bull flag, and rising on-chain engagement, the stage is set. Now it’s just a matter of whether DOGE delivers.


