


- XRP faces short-term downside risks as it forms a double top near $2.65 and breaks down from a rising wedge, potentially targeting $1.94 amid leveraged long position liquidations.
- On-chain data shows XRP’s NUPL metric entering the Belief–Denial zone, a phase that previously preceded sharp declines in 2018 and 2021.
- Despite near-term bearish signals, long-term projections remain bullish, with analysts eyeing potential rallies toward $3.69, $5.24, and even $17 based on wedge patterns and Fibonacci extensions.
Is the XRP Rally Running Out of Steam?
XRP has been on a rollercoaster lately, surging over 50% from a local low of $1.80 to its current level around $2.41. The rally, driven by improved market sentiment and the potential for an altseason, had traders eyeing further gains. But now, technical indicators are flashing caution signals, suggesting that the bullish run might be losing steam — at least for the short term.
Double Top and Rising Wedge: Signs of a Pullback
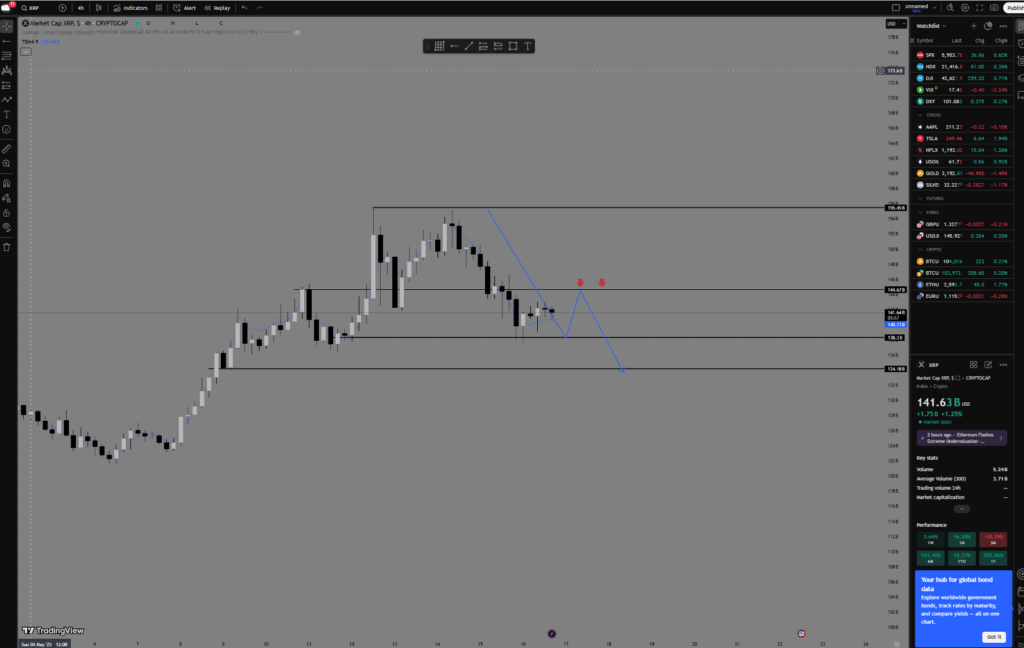
XRP’s recent price action has formed a classic double top pattern near $2.65, a structure that typically signals a bearish reversal. The setup consists of two distinct peaks at the same price level, with a neckline around $2.47. After the second peak, XRP dropped below the neckline, confirming the bearish formation. If the pattern plays out as expected, the downside target could extend to $2.30, representing a notable pullback from current levels.

Adding to the bearish case, XRP has also broken down from a rising wedge pattern. This formation, characterized by converging trendlines, usually indicates a shift from bullish to bearish momentum. The breakdown is considered confirmed when the price slips below the lower trendline, which XRP appears to be doing as of May 15.
To complicate matters, XRP is also testing support at the 50-4H EMA (exponential moving average). If it fails to hold this level, the next likely target is the $1.94 zone. This level is crucial not only because of the wedge breakdown but also due to the large number of leveraged long positions clustered around the $2.00–$2.04 range. According to data from CoinGlass, approximately $50 million in long positions could be at risk of liquidation if XRP drops below $2.00, potentially triggering a cascading long squeeze.
NUPL Analysis: Traders in Denial
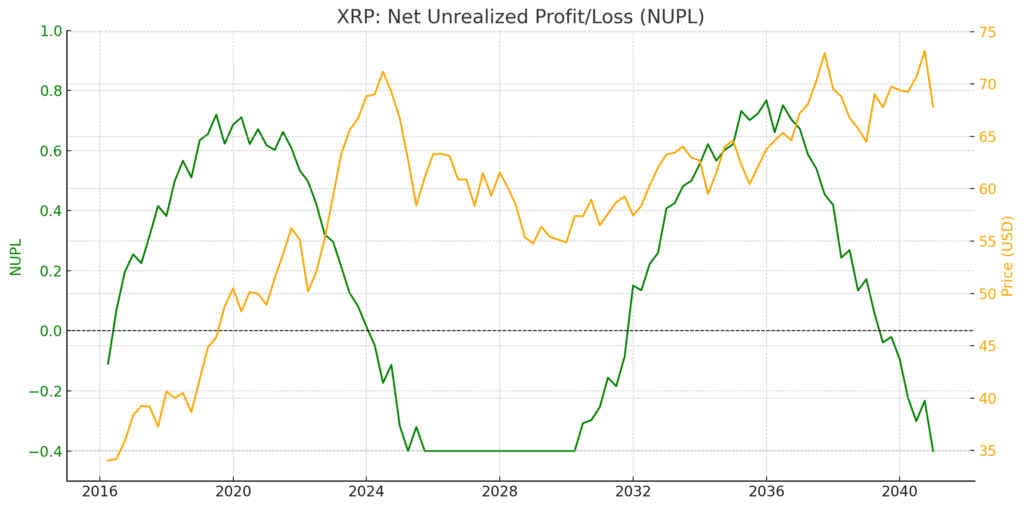
On-chain metrics are painting a troubling picture as well. XRP’s Net Unrealized Profit/Loss (NUPL) metric has shifted into the Belief–Denial zone, a phase where traders remain hopeful for further gains despite waning momentum. Historically, this phase has often marked the early stages of major corrections.
In 2018 and 2021, XRP entered the Belief–Denial zone before experiencing sharp declines, and the current setup suggests a similar risk. Traders holding on to positions with the expectation of another leg up may be in for a rude awakening if the broader market sentiment turns bearish.
Long-Term Outlook: Bullish Potential Remains
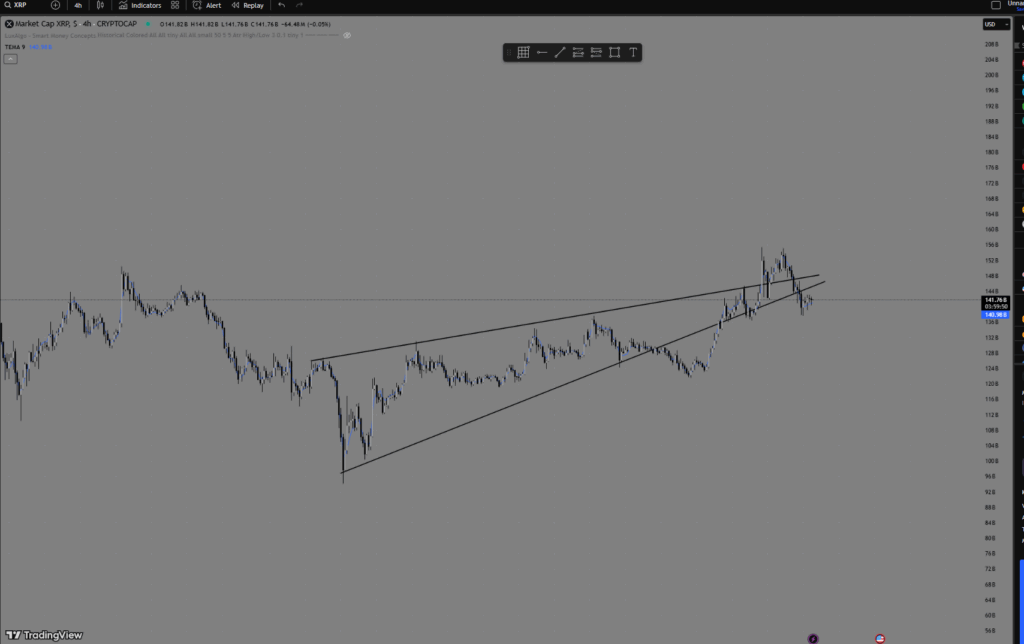
While the short-term technical outlook appears bleak, the long-term prospects for XRP still hold promise. If the token can reclaim key support levels and maintain its position above the 50-4H EMA, a breakout from a multimonth falling wedge pattern could set the stage for a significant rally.
Analysts are watching closely for a potential move toward $3.69 by June, a level that aligns with the upper boundary of the falling wedge. A decisive breakout above this level could pave the way for even higher targets, including $5.24 and $17, based on larger symmetrical triangle patterns and Fibonacci extensions.
However, those targets hinge on XRP’s ability to hold above critical support levels. If the token fails to stay above its 20-day and 50-day EMAs, the bullish setup could be invalidated, putting the $1.75 support zone in play.
Broader Market Context: What’s Next for XRP?
XRP’s outlook is not just about technical patterns — it’s also about market sentiment and broader macroeconomic conditions. The overall crypto market has seen a resurgence in recent weeks, with Bitcoin and Ethereum both staging comebacks from multi-month lows. If that momentum continues, XRP could benefit from increased risk appetite and a potential altseason rally.
Yet, the bearish patterns forming on the charts suggest caution. If leveraged positions start to unwind, the selling pressure could accelerate, pushing XRP closer to the $1.94 target. On the other hand, a bounce from the current support zone could trigger a fresh wave of buying, setting the stage for a run toward $3.69 and beyond.
For now, XRP remains at a critical juncture — a decisive move in either direction could set the tone for the next major price trend. Will the bears gain control and drive the price lower, or will the bulls step in to defend key support levels and push for new highs? The next few days could be crucial in determining XRP’s near-term trajectory.


