


- Key Resistance Ahead: Bitcoin may face strong resistance around the $91K–$92K range, aligning with the “Trader’s Realized Price” — a level where many current holders originally bought in.
- Market Sentiment Still Bearish: The market’s bull score remains below 60, indicating bearish sentiment. Historically, BTC struggles to break above this realized price in such conditions.
- Sell Wall at $92K: A major sell wall has formed at $92K on Binance, suggesting many traders are ready to take profits, which could cap further upside unless heavy buying pressure kicks in.
Bitcoin’s had a solid run lately, but with price action starting to cool a bit, investors are wondering: is this a short pause before another leg up—or are we running into resistance? On-chain analyst Julio Moreno thinks it might be the latter, and he’s pointing to one specific range to watch closely: the $91,000 to $92,000 zone.
Yep, that level’s turning heads.

Realized Price Is the Roadblock?
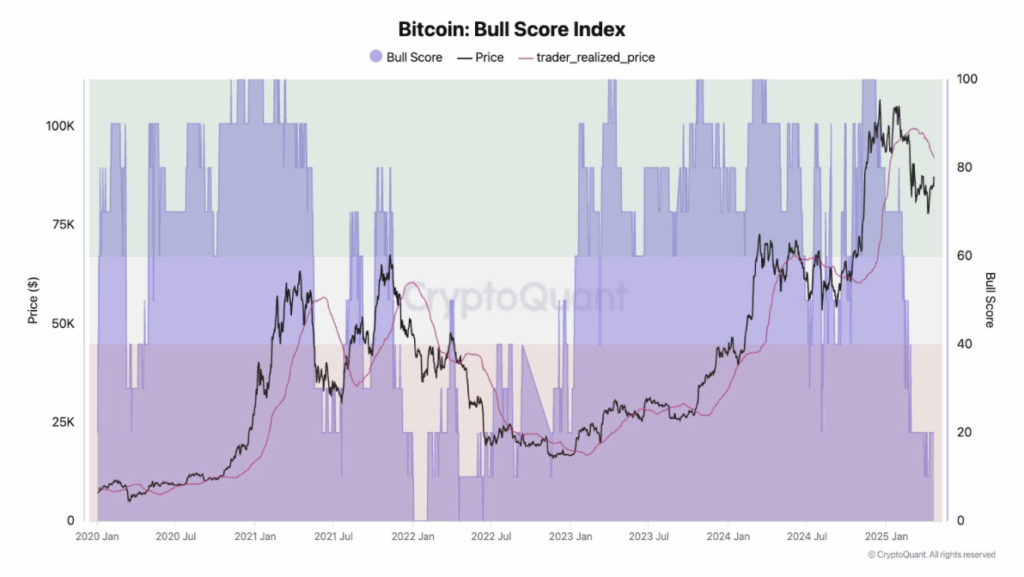
According to Moreno, that price area lines up almost perfectly with what’s called the “Trader’s Realized Price”—essentially, the average price most active holders paid for their BTC. It’s a key marker, often acting as a kind of psychological magnet or barrier, depending on market vibes.
In this case, the metric’s been plotted as a pink line on the charts Moreno shared, and historically, it tends to serve as a bounce zone in bull markets… or a ceiling in bearish ones. The trick is figuring out which mood the market’s in right now.
Market Mood: Still Kinda Gloomy
Moreno highlights a tool called the “bull score.” If it’s above 60 (green zone), we’re in bullish territory, and BTC tends to stick to this so-called “super region,” where price dips don’t last long and rebounds come quick.
But if the score’s under 40 (red zone), it’s another story—Bitcoin usually struggles to push past the pink line, and often pulls back. And guess what? That score’s still sitting below 60, shaded in red, signaling we might still be stuck in that bearish mood.
History Might Be Rhyming Again
Looking back at BTC price behavior from 2020 to now, Moreno’s chart shows a pattern. Every time Bitcoin got close to that trader realized price line during a bear phase, sellers started unloading, triggering either a dip or weeks of sideways chop.
And we might be heading into another one of those moments. BTC is inching toward that pink line again, and unless the market flips bullish fast, history suggests we might see a stall—or even a slide.
Oh, and just to pile on the caution: AetherCapital also spotted a huge sell wall sitting at $92K on Binance’s order book. That’s basically a cluster of massive limit sell orders—traders looking to cash out. It’s the kind of wall that can stop a rally dead in its tracks unless buyers come in heavy.
In short: Bitcoin looks strong, but there’s a technical and psychological speed bump just ahead. If it clears $92K with conviction? That’s big. If not? We could be in for a breather—or worse, a bit of a slide.
Let’s see if the bulls have one more push in ‘em.The Bitcoin Roadblock: Why $92,000 Could Be the Next Major Hurdle


