


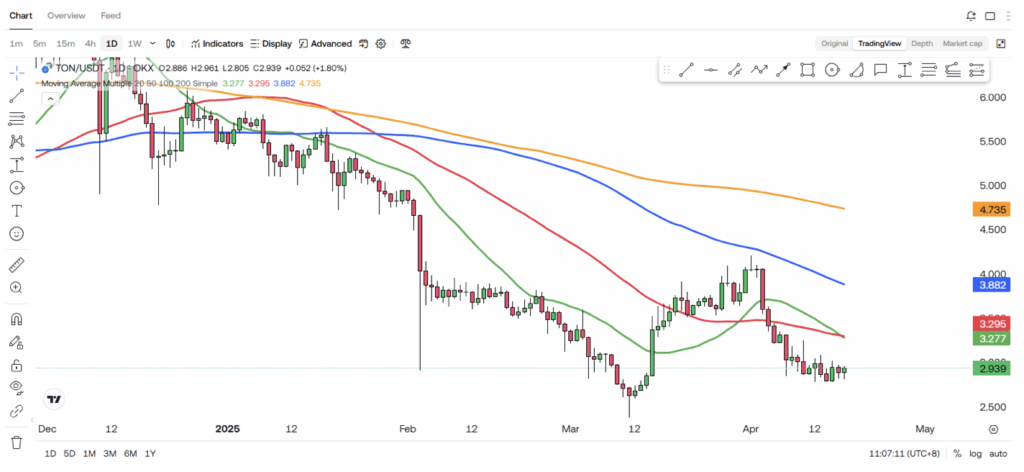
- Toncoin is down over 70% from its all-time high, with technical indicators like RSI, MACD, and moving averages still signaling bearish momentum.
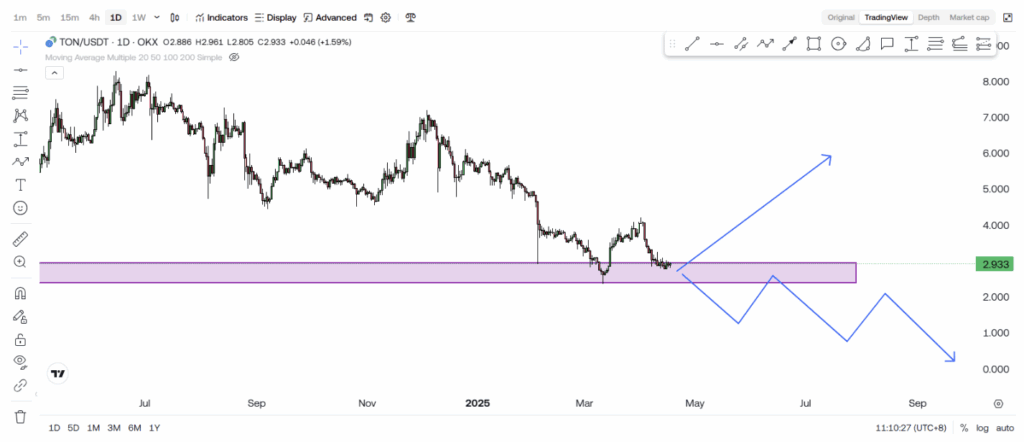
- TON is sitting on a key support zone between $2.30 and $2.80, a former resistance area that could flip into support — or break down into deeper losses.
- Hope isn’t off the table, but bulls need to hold the line; long-term believers might see this as an accumulation zone, while short-term traders should stay cautious.
Right now, Toncoin (TON) is trading around $2.94 — that’s more than 70% below its all-time high. Yeah, it stings. If you’ve been holding through the drop, you’re probably wondering if it’s time to cut losses… or double down. So, is there still a shot for a comeback?
Let’s break it down.

Still in the Bear Zone — No Sugarcoating It
First off — the moving averages aren’t looking great. The price is still stuck under the MA ribbon, which typically means the bears are still calling the shots. No real sign of reversal there. Until TON breaks back above those ribbons, it’s hard to get too excited.
Next up — the RSI (Relative Strength Index) is sitting below the 50 mark. That tells us momentum is weak. The bulls aren’t stepping in with enough force, and buyers aren’t quite ready to fight back. If RSI stays low, sellers are probably gonna keep the upper hand for now.
And then there’s the MACD — same story. It’s still hovering in the red, with no bullish crossover in sight. The histogram’s stuck below zero, and that’s a classic sign of ongoing downward pressure. Basically, from a pure indicator standpoint? It’s still rough out there.
But Here’s the Twist — A Major Support Zone
Now here’s where things get a little more interesting. Toncoin’s current price range — roughly between $2.30 and $2.80 — is actually sitting right on top of a major historical resistance zone. Back in the day, this was the area where rallies would get smacked down.
But now? That old resistance might be flipping into new support. That’s something technical traders love — it’s called role reversal, and it can be a big deal if the level holds.
If TON manages to hold above this support zone, we might see a bounce. But — and this is a big but — if price breaks clean below it, then that zone could flip right back into resistance… and we’d probably be looking at another leg down.
What Happens Next?
This $2.30–$2.80 zone is where bulls have to make a stand. If buyers step up and defend it, the area could become a solid base for a turnaround. But if we see heavy sell volume and a clean break below support, the market may not be done bleeding just yet.
So far, there’s not a ton of volume coming in either way — which kinda feels like the calm before the storm. Something’s brewing. It just hasn’t hit yet.
Zooming Out: Is There Still Hope for TON?
Look, it’s easy to feel discouraged after a 70% drop — but in crypto, that’s hardly unusual. We’ve seen tons of legit projects go through deep corrections before bouncing back harder than anyone expected.
The bigger question is: do you still believe in the fundamentals of Toncoin? If you think the project has long-term potential, then this might be a decent accumulation zone — especially for patient holders. But if you’re a short-term trader? You might wanna wait for clearer confirmation — maybe a bounce with volume, or a break above key levels — before making a move.
Final Thoughts
Toncoin’s chart isn’t screaming “buy” just yet — but it is sitting at a critical point. The support zone it’s resting on could either be the start of a reversal, or the last stop before another drop. It all comes down to what happens next — and whether bulls have enough fuel left to fight back.
So yeah… hope’s not dead. But caution? Still very much alive.


